
1MA0 Higher June 2017 Paper 1 Q19
*19 Some students were asked how many times they each used their mobile phones last week.
The box plots give information about the male students’ answers and about the female students’ answers.
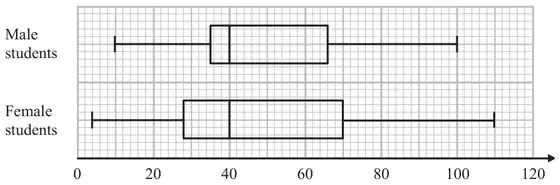
Compare the two distributions represented by the box plots. (3)
| Working | Answer | Mark | Notes | ||||||||||||
|---|---|---|---|---|---|---|---|---|---|---|---|---|---|---|---|
| Compare: medians and spread | 3 | C1 for any correct comparison of the medians C1 for any correct comparison of the IQRs or range C1 for a comparison of medians, IQRs or ranges written in context |