
D1 June 2011 Q7
7.
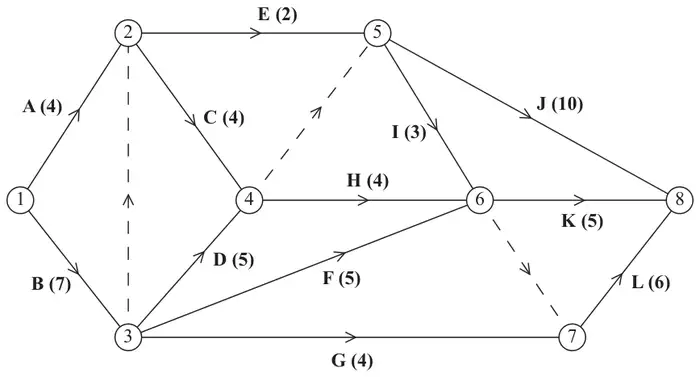
A project is modelled by the activity network shown in Figure 7. The activities are represented by the arcs. The number in brackets on each arc gives the time, in days, to complete the activity. Each activity requires one worker. The project is to be completed in the shortest possible time.
| Scheme | Marks | ||||||||||||||||||||||||||||||
|---|---|---|---|---|---|---|---|---|---|---|---|---|---|---|---|---|---|---|---|---|---|---|---|---|---|---|---|---|---|---|---|
| B3,2,1,0 | ||||||||||||||||||||||||||||||
| (3) |
Notes
(a)1B1 Any two rows correct
2B1 Any four rows correct
3B1 All seven rows correct
| Scheme | Marks |
|---|---|
 | M1 A1 M1 A1 |
| (4) |
Notes
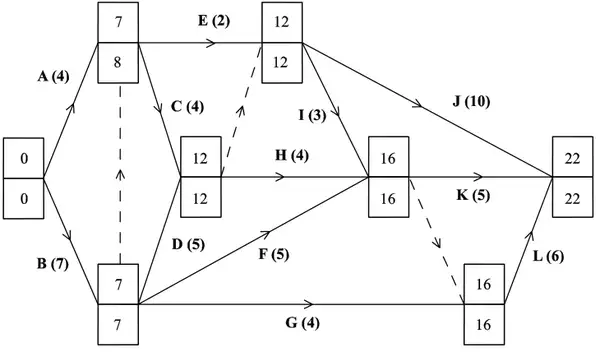
(b)1M1 All top boxes complete, values generally increasing left to right, condone one rogue
1A1 CAO
2M1 All bottom boxes complete, values generally decreasing R to L, condone one rogue
2A1 CAO
| Scheme | Marks |
|---|---|
| Critical activities are B D J H L | M1 A1 |
| (2) |
Notes
(c)M1 Accept dummies, repeats and condone one absence or one extra; or BDHL or BDJ
A1 CAO (dummies and repeats ok)
| Scheme | Marks |
|---|---|
 | M1 A1 M1 A1 |
| (4) |
Notes
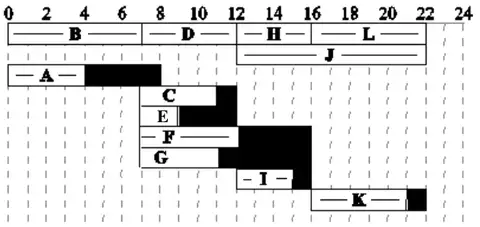
(d)1M1 At least 9 activities including at least 4 floats. Do not accept scheduling diagram.
1A1 Critical activities dealt with correctly
2M1 All 12 activities including at least 7 floats
2A1 Non-critical activities dealt with correctly.
| Scheme | Marks |
|---|---|
| E.g. Between time 7 and 16, 3 workers could do 3 x 9 = 27 days work. Activities C, D, E, F, G, H, I and 4 days of J need to be done This totals 31 days work. So it is not possible to complete the project with three workers. | B3,2,1,0 |
| OR If three workers are used three activities H, J and I need to happen at time 13.5, this reduces the float on F and G, meaning that at 10.5 D, C, F and G need to be happening. Our initial assumption is incorrect hence four workers are needed. | |
| (3) | |
| (16 marks) |
Notes
(e)1B1 Attempt at explanation – one correct idea.
2B1 Good explanation, some imprecise or vague statements – give bod
3B1 Fully correct explanation. No bod needed