
D1 June 2010 Q7
7.
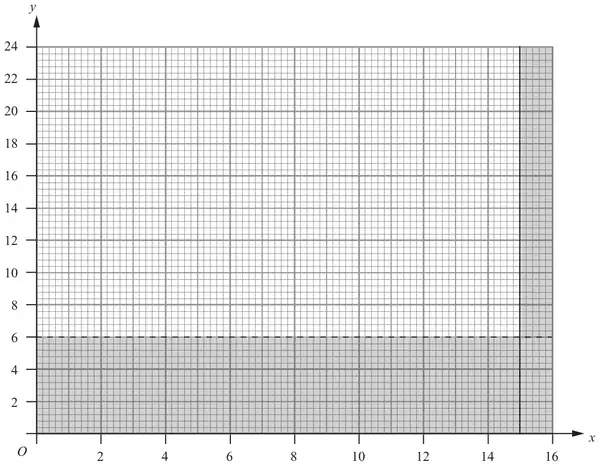
Keith organises two types of children’s activity, ‘Sports Mad’ and ‘Circus Fun’.
He needs to determine the number of times each type of activity is to be offered.
Let \(x\) be the number of times he offers the ‘Sports Mad’ activity. Let \(y\) be the number of times he offers the ‘Circus Fun’ activity.
Two constraints are
\[\begin{aligned}x &\leqslant 15\\ \text{and}\quad y &\gt 6\end{aligned}\]These constraints are shown on the graph in Figure 6, where the rejected regions are shaded out.
Two further constraints are
\[\begin{aligned}3x &\geqslant 2y\\ \text{and}\quad 5x + 4y &\geqslant 80\end{aligned}\]Each ‘Sports Mad’ activity costs £500.
Each ‘Circus Fun’ activity costs £800.
Keith wishes to minimise the total cost.
| Scheme | Marks |
|---|---|
| To indicate the strict inequality | B1 |
| (1) |
Notes
1B1: CAO
| Scheme | Marks |
|---|---|
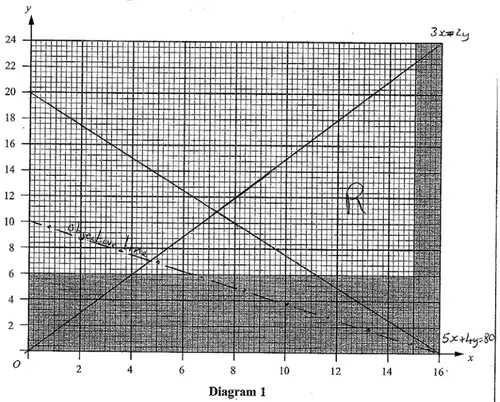
| \(3x = 2y\) and \(5x + 4y = 80\) added to the diagram. | B1, B1 |
| R correctly labelled. | B1 |
 | |
| (3) |
Notes
1B1: \(3x = 2y\) passing through 1 small square of (0,0) and (12, 18), but must reach x = 15
2B1: \(5x + 4y = 80\) passing through 1 small square of (0, 20) and (16, 0) (extended if necessary) but must reach y = 6
3B1: R CAO (condoning slight line inaccuracy as above.)
| Scheme | Marks |
|---|---|
| [Minimise C =] \(500x + 800y\) | B1, B1 |
| (2) |
Notes
1B1: Accept expression and swapped coefficients. Accept 5x + 8y for 1 mark
2B1: CAO (expression still ok here)
| Scheme | Marks |
|---|---|
| Point testing or Profit line | M1 A1 |
| Seeking integer solutions | M1 |
| (11, 7) at a cost of £ 11 100. | B1, B1 |
| (5) | |
| (11 marks) |
Notes
1M1: Profit line [gradient accept reciprocal, minimum length line passes through (0, 2.5) (4, 0)] OR testing 2 points in their FR near two different vertices.
1A1: Correct profit line OR 2 points correctly tested in correct FR (my points)
e.g
\[\begin{array}{lcl}(7\tfrac{3}{11}, 10\tfrac{10}{11}) = 12\,363\tfrac{7}{11} & \text{or} & (7,11) = 12\,300\\ & & (8,10) = 12\,000\\ & & (8,11) = 12\,800\\ (11\tfrac{1}{5}, 6) = 10\,400 & \text{or} & (11,6) = 10\,300\\ (15,6) = 12\,300 & \text{or} & (15,7) = 13\,100\\ (15, 22\tfrac{1}{2}) = 25\,500 & \text{or} & (15,22) = 25\,100\\ & (11,7) = 11\,100 &\end{array}\]2M1: Seeking integer solution in correct FR (so therefore no y = 6 points)
1B1: (11,7) CAO
2B1: £11 100 CAO