
S3 June 2015 Q6
6.
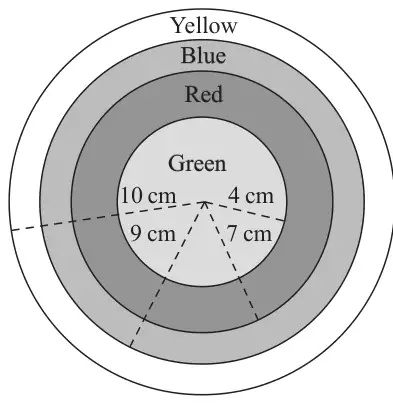
The sketch in Figure 1 represents a target which consists of 4 regions formed from 4 concentric circles of radii 4 cm, 7 cm, 9 cm and 10 cm. The regions are coloured as labelled in Figure 1.
A random sample of 100 children each choose a point on the target and their results are summarised in the table below.
| Colour of region | Green | Red | Blue | Yellow |
| Frequency | 22 | 39 | 25 | 14 |
Caitland is trying to model the distribution of the points chosen by the children. She defines the random variable \(D\) to be the distance, in cm, of a point from the centre of the target and assumes \(D \sim \mathrm{U}[0, 10]\).
Henry claims that the points are randomly distributed over the target and the probability of a point being in any particular region is proportional to the area of that region.
He calculates expected frequencies and obtains the following table.
| Colour of region | Green | Red | Blue | Yellow |
| Expected frequency | 16 | 33 | \(r\) | \(s\) |
Henry obtained a test statistic of 6.188 and no groups were pooled.
Phoebe believes that the children chose the region of the target according to colour. She believes that boys and girls would favour different colours and splits the original data by gender to obtain the following table.
Observed frequencies
| Colour of region | Green | Red | Blue | Yellow | Total |
| Boys | 10 | 12 | 10 | 3 | 35 |
| Girls | 12 | 27 | 15 | 11 | 65 |
Phoebe calculated the following expected frequencies to carry out a suitable test.
Expected frequencies
| Colour of region | Green | Red | Blue | Yellow |
| Boys | 7.7 | 13.65 | 8.75 | 4.9 |
| Girls | 14.3 | 25.35 | 16.25 | 9.1 |
Phoebe carried out the test using 2 degrees of freedom and a 10% level of significance.
She obtained a test statistic of 1.411
| Scheme | Marks | |||||||||||||||||||||||||
|---|---|---|---|---|---|---|---|---|---|---|---|---|---|---|---|---|---|---|---|---|---|---|---|---|---|---|
| \(\mathrm{H_0}\): U[0, 10] is a suitable model \(\mathrm{H_1}\): U[0, 10] is not a suitable model | B1 | |||||||||||||||||||||||||
Values of \(D\) (B1); Expected Freq (M1A1); 4th or 5th col (M1); \(\chi^2 = 13.65\) (A1) | B1 M1A1 M1 A1 | |||||||||||||||||||||||||
| \(\nu = 3\), \(\chi^2_3(1\%) = 11.345\) | B1, B1 | |||||||||||||||||||||||||
| [Reject \(\mathrm{H_0}\),] the uniform distribution over [0, 10] is not a suitable model | A1 | |||||||||||||||||||||||||
| (9) |
Notes
2nd B1 for the correct values for \(D\) (can be implied by 40, 30, 20, and 10.)
1st M1 for at least 2 expected frequencies or clear use of a correct formula e.g. \(0.4N\)
1st A1 for all the correct \(E_i\)
2nd M1 for at least 2 correct calculations from 4th or 5th column
2nd A1 for a test statistic of 13.65 (accept 13.7 to 3 sf)
Awrt 13.7 only scores 2nd B1M1A1M1A1
3rd A1 for a correct conclusion rejecting the uniform model. Award provided their test statistic > 11.345
| Scheme | Marks |
|---|---|
| Area \(\propto \pi R^2\) so \(r = 81, -49 = \)32 | M1, A1 |
| \(s = 100 - \text{“32”} - 49\) or \(100 - 81 = \)19 | B1ft |
| (3) |
Notes
M1 for some attempt to use \(\pi R^2\) to find \(r\)
| Scheme | Marks |
|---|---|
| Not significant, Henry’s model is suitable | M1, A1 |
| (2) |
Notes
M1 for a correct statement that it is not significant
A1 for correctly stating that Henry’s model is suitable o.e.
| Scheme | Marks |
|---|---|
| \(\mathrm{H_0}\): The colour/region chosen for the points is independent of gender (or no assoc’) \(\mathrm{H_1}\): The colour/region chosen for the points is dependent on gender (or assoc’) | B1 |
| (1) |
Notes
B1 Independence or association mentioned at least once if ditto marks used.
Allow connection but not correlation.
| Scheme | Marks |
|---|---|
| \(\dfrac{39 \times 65}{100}\) | B1 |
| (1) |
| Scheme | Marks |
|---|---|
| Expected frequency for Yellow and Boys is 4.9 < 5 so col. must be pooled/combined. [This gives a \(2 \times 3\) table so \(\nu = (2 - 1) \times (3 - 1) = 2\)] | B1 |
| (1) |
Notes
B1 for recognising there is an \(E_i \lt 5\) and need for pooling/combining oe
| Scheme | Marks |
|---|---|
| cv = 4.605 | B1 |
| [Not significant] so the data do not support Phoebe’s belief oe | B1 |
| (2) | |
| (19 marks) |
Notes
2nd B1 for correctly stating that Phoebe’s belief is not supported by the data oe (depends on their cv being > 1.411)