
S3 June 2008 Q3
3. The product moment correlation coefficient is denoted by \(r\) and Spearman’s rank correlation coefficient is denoted by \(r_s\).
Two judges rank seven collie dogs in a competition. The collie dogs are labelled \(A\) to \(G\) and the rankings are as follows
| Rank | 1 | 2 | 3 | 4 | 5 | 6 | 7 |
|---|---|---|---|---|---|---|---|
| Judge 1 | \(A\) | \(C\) | \(D\) | \(B\) | \(E\) | \(F\) | \(G\) |
| Judge 2 | \(A\) | \(B\) | \(D\) | \(C\) | \(E\) | \(G\) | \(F\) |
| Scheme | Marks |
|---|---|
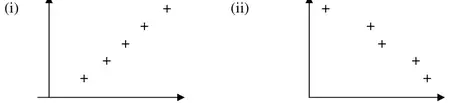 | (i) B1 (ii) B1B1 |
| (3) |
Notes
(i) 1st B1 for 5 or more points on a straight line of positive gradient
(ii) 2nd B1 for 4 or more points satisfying \(-1 \lt r \lt 0\)
3rd B1 for 5 or more points of decreasing ranks not on a straight line
| Scheme | Marks | ||||||||||||||||||||||||||||||||
|---|---|---|---|---|---|---|---|---|---|---|---|---|---|---|---|---|---|---|---|---|---|---|---|---|---|---|---|---|---|---|---|---|---|
(i)
| M1M1 | ||||||||||||||||||||||||||||||||
| \(\sum d^2 = 10\) | M1A1 | ||||||||||||||||||||||||||||||||
| \(r_s = 1 - \dfrac{6 \times 10}{7 \times (49 - 1)} = 1 - \dfrac{5}{28} = \dfrac{23}{28}\) or awrt 0.821 | M1A1 | ||||||||||||||||||||||||||||||||
| (6) | |||||||||||||||||||||||||||||||||
| (ii) \(\mathrm{H}_0 : \rho = 0 \qquad \mathrm{H}_1 : \rho \gt 0\) (Allow \(\rho_S\)) (\(\mathrm{H}_1 : \rho \neq 0\) scores B0) | B1,B1 | ||||||||||||||||||||||||||||||||
| \(r_s\) 5% one tail critical value is 0.7143 | B1 | ||||||||||||||||||||||||||||||||
| Significant result or reject null hypothesis | M1 | ||||||||||||||||||||||||||||||||
| There is evidence of a (positive) correlation between the judges or the judges agree | A1ft | ||||||||||||||||||||||||||||||||
| (5) | |||||||||||||||||||||||||||||||||
| (14 marks) |
Notes
(i) 1st M1 for attempting to rank one of the judges (at least 2 correct rankings)
2nd M1 for ranking both (may be reversed) (at least 2 correct rankings)
3rd M1 for attempting \(d^2\).
1st A1 for \(\sum d^2 = 10\)
4th M1 for correct use of the \(r_s\) formula
(ii) 3rd B1 for the correct critical value – depends upon their \(\mathrm{H}_1\): \(\rho \gt 0\) needs 0.7143, \(\rho \neq 0\), 0.7857
The \(\mathrm{H}_1\) may be in words so B0B1 is possible. If no \(\mathrm{H}_1\) award for 0.7143 only.
5th M1 for a correct statement relating their \(r_s\) and their cv (may be implied by correct comment)
3rd A1ft follow through their \(r_s\) and their cv. Comment in context. Must mention judges.
Don’t insist on “positive” and condone it if they are using \(\rho \neq 0\).