
S3 June 2005 Q4
4. Over a period of time, researchers took 10 blood samples from one patient with a blood disease. For each sample, they measured the levels of serum magnesium, \(s\) mg/dl, in the blood and the corresponding level of the disease protein, \(d\) mg/dl. The results are shown in the table.
| \(s\) | 1.2 | 1.9 | 3.2 | 3.9 | 2.5 | 4.5 | 5.7 | 4.0 | 1.1 | 5.9 |
|---|---|---|---|---|---|---|---|---|---|---|
| \(d\) | 3.8 | 7.0 | 11.0 | 12.0 | 9.0 | 12.0 | 13.5 | 12.2 | 2.0 | 13.9 |
[Use \(\sum s^2 = 141.51\), \(\sum d^2 = 1081.74\) and \(\sum sd = 386.32\)]
(a) Draw a scatter diagram to represent these data. (3)
(b) State what is measured by the product moment correlation coefficient. (1)
(c) Calculate \(S_{xx}\), \(S_{dd}\) and \(S_{sd}\). (3)
(d) Calculate the value of the product moment correlation coefficient \(r\) between \(s\) and \(d\). (2)
(e) Stating your hypotheses clearly, test, at the 1% significance level, whether or not the correlation coefficient is greater than zero. (3)
(f) With reference to your scatter diagram, comment on your result in part (e). (1)
| Scheme | Marks |
|---|---|
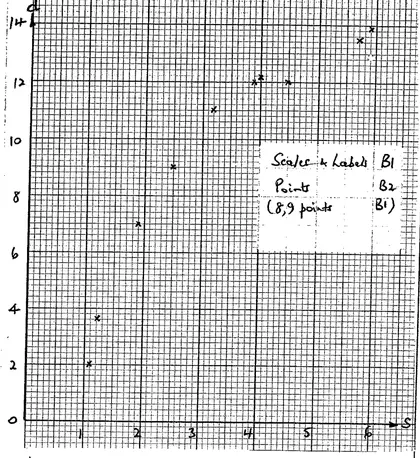 | B1 B2 |
| (3) |
Notes
Scales & Labels B1; Points B2 (8, 9 points B1)
| Scheme | Marks |
|---|---|
| Linear association between \(s\) and \(d\) | B1 |
| (1) |
| Scheme | Marks |
|---|---|
| \(S_{ss} = 141.51 - \dfrac{33.9^2}{10} = \underline{26.589}\); \(S_{dd} = \underline{152.444}\); \(S_{sd} = \underline{59.524}\) | B1; B1; B1 |
| (3) |
| Scheme | Marks |
|---|---|
| \(r = \dfrac{59.524}{\sqrt{152.444 \times 26.589}}\) | M1 |
| \(= \underline{0.93494\ldots}\) AWRT 0.935 | A1 |
| (2) |
| Scheme | Marks |
|---|---|
| \(\mathrm{H}_0: \rho = 0\); \(\mathrm{H}_1: \rho \gt 0\) | B1 |
| Critical value at 1% = 0.7155 | B1 |
| Reject \(\mathrm{H}_0\); levels of serum & disease are positively correlated | B1 |
| (3) |
| Scheme | Marks |
|---|---|
| Linear correlation significant but scatter diagram looks non-linear. | B1 |
| (1) | |
| (13 marks) |