
M1 January 2011 Q5
5. A car accelerates uniformly from rest for 20 seconds. It moves at constant speed \(v\) m s\(^{-1}\) for the next 40 seconds and then decelerates uniformly for 10 seconds until it comes to rest.
(a) For the motion of the car, sketch
(i) a speed-time graph,
(ii) an acceleration-time graph.
(6)
Given that the total distance moved by the car is 880 m,
(b) find the value of \(v\). (4)
(i)
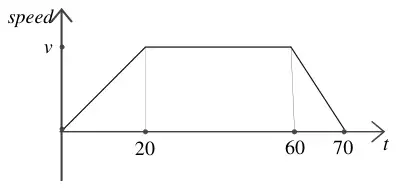
| Scheme | Marks |
|---|---|
| 1st section correct | B1 |
| 2nd & 3rd sections correct | B1 |
| Numbers and \(v\) marked correctly on the axes. | DB1 |
(ii)
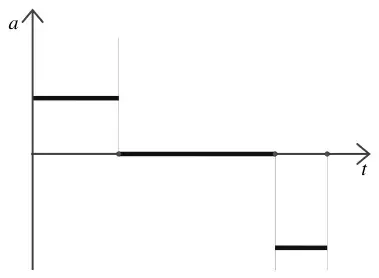
| Scheme | Marks |
|---|---|
| 1st section correct | B1 |
| 2nd section correct | B1 |
| 3rd section correct and no “extras” on the sketch | B1 |
| (6) |
| Scheme | Marks |
|---|---|
| \(\dfrac{70 + 40}{2} \times v = 880\) | M1 A1 |
| \(v = 880 \times \dfrac{2}{110} = 16\) | DM1 A1 |
| (4) | |
| (10 marks) |