
S1 June 2015 Q1
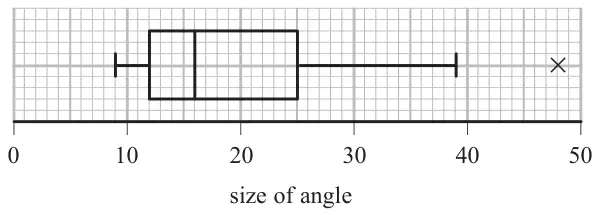
1. Each of 60 students was asked to draw a \(20^\circ\) angle without using a protractor. The size of each angle drawn was measured. The results are summarised in the box plot below.
The students were then asked to draw a \(70^\circ\) angle.
The results are summarised in the table below.
| Angle, \(a\), (degrees) | Number of students |
|---|---|
| \(55 \leqslant a \lt 60\) | 6 |
| \(60 \leqslant a \lt 65\) | 15 |
| \(65 \leqslant a \lt 70\) | 13 |
| \(70 \leqslant a \lt 75\) | 11 |
| \(75 \leqslant a \lt 80\) | 8 |
| \(80 \leqslant a \lt 85\) | 7 |
For these data, the upper quartile is \(75^\circ\), the minimum is \(55^\circ\) and the maximum is \(84^\circ\)
An outlier is an observation that falls either
more than \(1.5 \times\) (interquartile range) above the upper quartile or
more than \(1.5 \times\) (interquartile range) below the lower quartile.
| Scheme | Marks |
|---|---|
| [Range = 48 – 9] = 39 | B1 |
| (1) |
| Scheme | Marks |
|---|---|
| [IQR = 25 – 12 ]= 13 | B1 |
| (1) |
| Scheme | Marks |
|---|---|
| \(\text{Median} = 65 + \dfrac{[9]}{13} \times 5 = \dfrac{890}{13}\) = awrt 68.5\(^\circ\) \(\left[\text{Condone: } 65 + \dfrac{[9.5]}{13} \times 5 = 68.7\right]\) | M1 A1 |
| (2) |
Notes
M1 for an attempt (should have 65 or 70, 13 and 5) NB working down: \(70 - \dfrac{[4]}{13} \times 5\)
Allow any correct method leading to \(\frac{890}{13}\), the “5” may be implied by 65 and 70 seen
A1 awrt 68.5 (condone 68.7 if (\(n\)+1) is used). Ans only of 68.5 is 2/2 but 68.7 needs M1
| Scheme | Marks |
|---|---|
| \(\text{Lower Quartile} = 60 + \dfrac{9}{15} \times 5 = \)63 (*) | M1 A1cso |
| (2) |
Notes
M1 for correct expression for the lower quartile (condone 9.25 if (\(n\)+1) used)
Watch out for working down e.g. \(65 - \dfrac{6}{15} \times 5\) (M1) but e.g. \(\dfrac{60 + 65}{2} = 62.5 = 63\) is M0
A1 for correct solution with no incorrect working seen (condone (\(n\)+1) giving 63.08..)
| Scheme | Marks |
|---|---|
| (i) \(63 - 1.5 \times (75 - 63) = 45\) \(75 + 1.5 \times (75 - 63) = 93\) | M1A1 |
| No data above 93 and no data below 45 or 55>45 etc or there are no outliers. | A1 |
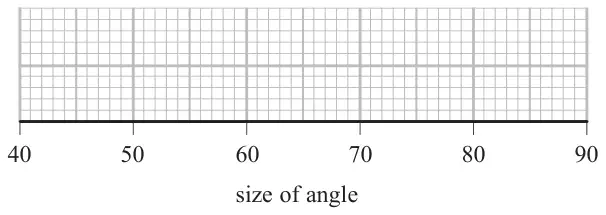
(ii)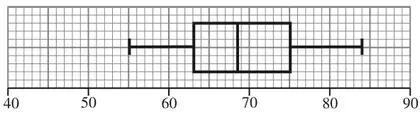 | M1 A1ft |
| (5) |
Notes
(i) M1 for either correct calculation (may be implied by one correct limit)
A1 for either 45 or 93
A1 for 45 and 93 and conclusion
(ii) M1 for a box with 1 whisker drawn on each side (must see the line drawn)
A1ft their median \(63 \lt Q_2 \lt 75\) but quartiles (63 and 75), 55 and 84 must be correct.
Accuracy Use 0.5 sq. accuracy so condone median on 68 or 69 if 68.5 seen
| Scheme | Marks |
|---|---|
| Median for the \(70^\circ\) angle is closer (to \(70^\circ\))[ than the \(20^\circ\) median is to \(20^\circ\)] | B1 |
| The range/IQR for the \(70^\circ\) angle box plot is smaller/shorter | B1 |
| Therefore, students were more accurate at drawing the \(70^\circ\) angle. | dB1 |
| (3) | |
| (14 marks) |
Notes
1st B1 for correct comparison of their medians (63 < (c) < 75) to true value
2nd B1 for correct comparison of their range or IQR (“spread” is B0)
Allow saying IQRs of 12 and 13 are similar. Ignore mention of “skewness” or “outliers”
3rd dB1 dependent upon at least one previous B1 being scored for choosing \(70^\circ\)