
S1 June 2014 Q1
1. A random sample of 35 homeowners was taken from each of the villages Greenslax and Penville and their ages were recorded. The results are summarised in the back-to-back stem and leaf diagram below.
| Totals | Greenslax | Penville | Totals | |
|---|---|---|---|---|
| (2) | 8 7 | 2 | 5 5 6 7 8 8 9 | (7) |
| (3) | 9 8 7 | 3 | 1 1 1 2 3 4 4 5 6 7 9 | (11) |
| (4) | 4 4 4 0 | 4 | 0 1 2 4 7 | (5) |
| (5) | 6 6 5 2 2 | 5 | 0 0 5 5 5 | (5) |
| (7) | 8 6 5 4 2 1 1 | 6 | 2 5 6 6 | (4) |
| (8) | 8 6 6 6 4 3 1 1 | 7 | 0 5 | (2) |
| (5) | 9 8 4 3 2 | 8 | (0) | |
| (1) | 4 | 9 | 9 | (1) |
Key: 7 | 3 | 1 means 37 years for Greenslax and 31 years for Penville
Some of the quartiles for these two distributions are given in the table below.
| Greenslax | Penville | |
|---|---|---|
| Lower quartile, \(Q_1\) | \(a\) | 31 |
| Median, \(Q_2\) | 64 | 39 |
| Upper quartile, \(Q_3\) | \(b\) | 55 |
An outlier is a value that falls either
more than \(1.5\times(Q_3 - Q_1)\) above \(Q_3\)
or more than \(1.5\times(Q_3 - Q_1)\) below \(Q_1\)
| Scheme | Marks |
|---|---|
| \(a = 44\) | B1 |
| \(b = 76\) These answers may be in or near the table | B1 |
| (2) |
| Scheme | Marks |
|---|---|
| \(55 + 1.5(55 - 31) = 91\) [and \(31 - 1.5(55 - 31) = -5\)] | M1 |
Penville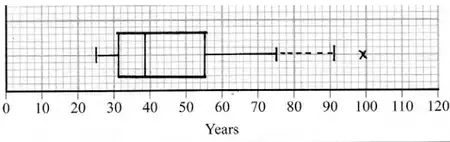 | B1 B1 A1 |
| (4) |
Notes
A fully correct box plot scores 4/4. If not fully correct apply scheme and need evidence for M1
If two box plots are seen ignore the one for Greenslax. If not on graph paper M1 max for (b)
M1 for sight of \(55 + 1.5(55 - 31)\) or 91 seen (possibly implied by RH whisker of box plot). May be implied by a fully correct box plot
1st B1 box with whiskers (condone missing median)
2nd B1 25, 31, 39, 55, RH whisker to end at 75 or 91. Two RH whiskers is B0. Accuracy must be to within 0.5 of a square so e.g. lower quartile at 30 or 32 is OK
A1 only one outlier plotted at 99. Allow cross to be vertically displaced. If the RH whisker goes to 99 (2nd B0) and A0 even if outlier is identified since we require a horizontal “gap” between RH whisker and outlier.
| Scheme | Marks |
|---|---|
| Greenslax : \([Q_2 - Q_1 = 20,\ Q_3 - Q_2 = 12\) or \((Q_2 - Q_1) \gt (Q_3 - Q_2)] \Rightarrow\) −ve(skew ) | B1 |
| Penville: \([Q_2 - Q_1 = 8,\ Q_3 - Q_2 = 16\) or \((Q_3 - Q_2) \gt (Q_2 - Q_1)] \Rightarrow\) +ve (skew ) | B1 |
| Don’t insist on seeing “skew” so just –ve and +ve will do. Treat “correlation” as ISW Justification that is consistent | ddB1 |
| (3) | |
| (9 marks) |
Notes
1st B1 Greenslax – ve (skew)
2nd B1 Penville + ve (skew).
We must be able to tell which is which but labels may be implied by their values but not simply from \(Q_3 - Q_2 \gt Q_2 - Q_1\). If there is just one, unlabelled comment assume Penville.
3rd ddB1 dependent on 1st and 2nd B marks being scored. Justification for both based on: quartiles, median relative to quartiles, or “tail”
If only values for \(Q_3 - Q_2\) etc are given they should be correct ft for Greenslax and correct for Penville
If values for Greenslax imply +ve skew then 1st B0 and 3rd B0