
S1 January 2012 Q1
1. The histogram in Figure 1 shows the time, to the nearest minute, that a random sample of 100 motorists were delayed by roadworks on a stretch of motorway.
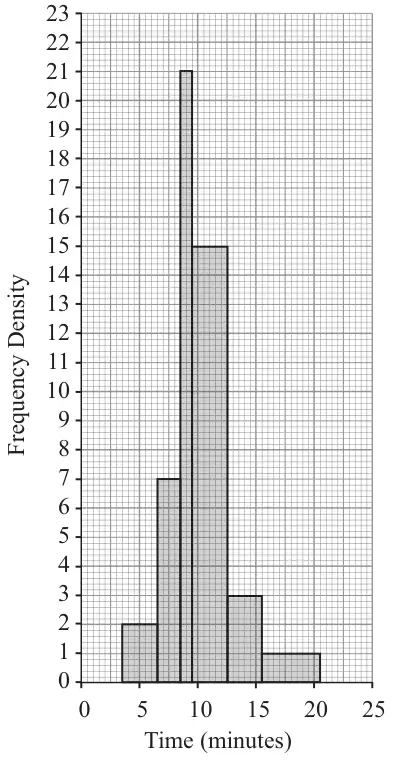
(a) Complete the table.
(2)
| Delay (minutes) | Number of motorists |
|---|---|
| 4 – 6 | 6 |
| 7 – 8 | |
| 9 | 21 |
| 10 – 12 | 45 |
| 13 – 15 | 9 |
| 16 – 20 |
(b) Estimate the number of motorists who were delayed between 8.5 and 13.5 minutes by the roadworks. (2)
| Scheme | Marks |
|---|---|
| 14, 5 | M1 A1 |
| (2) |
Notes
M1 for 2x7 or 14 or 5x1 or 5
A1 for both 14 and 5
| Scheme | Marks |
|---|---|
| 21 + 45 + 3 = 69 | M1 A1 |
| (2) | |
| (4 marks) |
Notes
M1 for 21+45+(0<frequency <9)
A1 for 69 only.
69 no working, award M1A1 Incorrect answer with no working M0A0