
S1 January 2011 Q3
3. Over a long period of time a small company recorded the amount it received in sales per month. The results are summarised below.
| Amount received in sales (£1000s) | |
|---|---|
| Two lowest values | 3, 4 |
| Lower quartile | 7 |
| Median | 12 |
| Upper quartile | 14 |
| Two highest values | 20, 25 |
An outlier is an observation that falls
either 1.5 \(\times\) interquartile range above the upper quartile
or 1.5 \(\times\) interquartile range below the lower quartile.
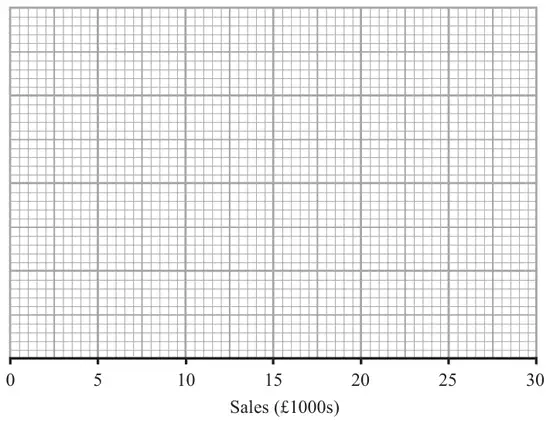
| Scheme | Marks |
|---|---|
| Outliers \(14 + 1.5 \times (14 - 7) = 24.5\) | M1 |
| \(7 - 1.5 \times (14 - 7) = -3.5\) | A1 |
| Outlier 25 either upper limit acceptable on diagram 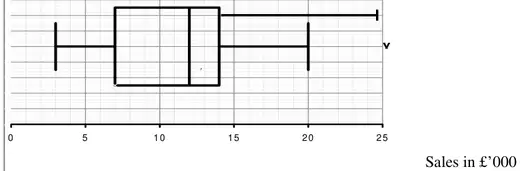 | M1 A1ft B1 |
| (5) |
Notes
A fully correct box-plot (either version) with no supporting work scores 5/5. Otherwise read on
1st M1 for at least one correct calculation seen
1st A1 for 24.5 and \(-3.5\) (or just negative noted) seen. May be read off the graph.
If both values are seen but no calculation is given then M1A1,one value M1A0.
2nd M1 for a box with an upper and a lower whisker(s) with at least 2 correct values (condone no median marked)
2nd A1ft for 3,7, 12, 14 and 20 or 24.5 in appropriate places and readable off their scale
If both upper whiskers are seen A0
Apply ft for their whiskers being compatible with their outlier limits
e.g. if their lower limit is + 3.5 then a lower whisker ending at 4 or 3.5 is OK
B1 for only one outlier appropriately marked at 25
Apply \(\pm\) 0.5 square accuracy for diagram
| Scheme | Marks |
|---|---|
| Since \(Q_3 - Q_2 \lt Q_2 - Q_1\). Allow written explanation negatively skew | B1 dB1 |
| (2) |
Notes
1st B1 for \(Q_3 - Q_2 \lt Q_2 - Q_1\) statement or an equivalent statement in words
Use of \(Q_3 - Q_2 \lt Q_2 - Q_1\) does not require differences to be seen.
2nd dB1 for “negative skew” dependent on suitable reason given above. “correlation” is B0
“positive skew” with a supporting argument based on whiskers can score B1B1
e.g. “right hand whisker is longer than LH one so positive skew”
\(Q_3 - Q_2 \lt Q_2 - Q_1\) followed by “positive skew” is B1B0
| Scheme | Marks |
|---|---|
| not true since the lower quartile is 7000 and therefore 75% above 7000 not 10000 or 10 is inside the box or any other sensible comment | B1 dB1 |
| (2) | |
| (9 marks) |
Notes
1st B1 for rejecting the company’s claim
2nd dB1 for an appropriate supporting reason. Dependent on rejecting company’s claim.