
S1 June 2006 Q1
1.
(a) Describe the main features and uses of a box plot. (3)
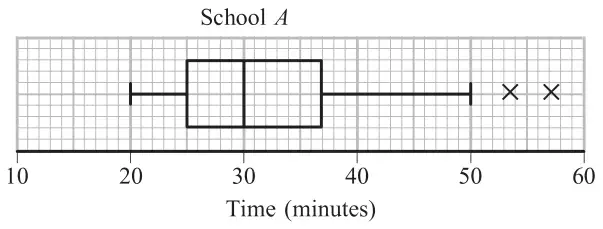
Children from schools \(A\) and \(B\) took part in a fun run for charity. The times, to the nearest minute, taken by the children from school \(A\) are summarised in Figure 1.
(b)
(i) Write down the time by which 75% of the children in school \(A\) had completed the run.
(ii) State the name given to this value. (2)
(c) Explain what you understand by the two crosses (×) on Figure 1. (2)
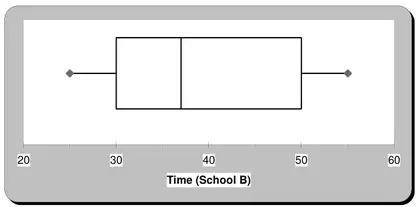
For school \(B\) the least time taken by any of the children was 25 minutes and the longest time was 55 minutes. The three quartiles were 30, 37 and 50 respectively.
(d) Draw a box plot to represent the data from school \(B\). (4)
(e) Compare and contrast these two box plots. (4)
| Scheme | Marks |
|---|---|
| Indicates max / median / min / upper quartile/ lower quartile (2 or more) Indicates outliers (or equivalent description) Illustrates skewness (or equivalent description e.g. shape) Allows comparisons Indicates range / IQR / spread | B1 B1 B1 |
| (3) |
Notes
B1B1B1 Any 3 rows
| Scheme | Marks |
|---|---|
| (i) 37 (minutes) | B1 |
| (ii) Upper quartile or \(\mathrm{Q}_3\) or third quartile or 75th percentile or \(\mathrm{P}_{75}\) | B1 |
| (2) |
| Scheme | Marks |
|---|---|
| Outliers How to calculate correctly ‘Observations that are very different from the other observations and need to be treated with caution’ These two children probably walked / took a lot longer | B1 B1 |
| (2) |
Notes
B1B1 Any 2
| Scheme | Marks |
|---|---|
| Box & median & whiskers | M1 |
| Sensible scale | B1 |
| 30, 37, 50 | B1 |
| 25, 55 | B1 |
| (4) |
| Scheme | Marks |
|---|---|
| Children from school A generally took less time 50% of B \(\leqslant\) 37 mins, 75% of A < 37 mins (similarly for 30) Median/Q1/Q3 of A < median/Q1/Q3 of B (1 or more) A has outliers, (B does not) Both positive skew IQR of A<IQR of B, range of A>range of B | B1 B1 B1 B1 |
| (4) | |
| (15 marks) |
Notes
B1B1B1B1 Any correct 4 lines