
S1 January 2005 Q2
2. The number of caravans on Seaview caravan site on each night in August last year is summarised in the following stem and leaf diagram.
| Caravans | \(1 \mid 0\) means 10 | Totals |
|---|---|---|
| 1 | 0 5 | (2) |
| 2 | 1 2 4 8 | (4) |
| 3 | 0 3 3 3 4 7 8 8 | (8) |
| 4 | 1 1 3 5 8 8 8 9 9 | (9) |
| 5 | 2 3 6 6 7 | (5) |
| 6 | 2 3 4 | (3) |
(a) Find the three quartiles of these data. (3)
During the same month, the least number of caravans on Northcliffe caravan site was 31. The maximum number of caravans on this site on any night that month was 72. The three quartiles for this site were 38, 45 and 52 respectively.
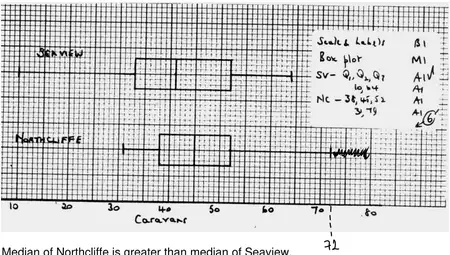
(b) On graph paper and using the same scale, draw box plots to represent the data for both caravan sites. You may assume that there are no outliers. (6)
(c) Compare and contrast these two box plots. (3)
(d) Give an interpretation to the upper quartiles of these two distributions. (2)
| Scheme | Marks |
|---|---|
| \(\mathrm{Q}_1 = 33,\ \mathrm{Q}_2 = 41,\ \mathrm{Q}_3 = 52\) | B1B1B1 |
| (3) |
| Scheme | Marks |
|---|---|
| Scale & labels | B1 |
| Box plot | M1 |
| SV – \(\mathrm{Q}_1, \mathrm{Q}_2, \mathrm{Q}_3\) | A1ft |
| 10, 64 | A1 |
| NC – 38, 45, 52 | A1 |
| 31, 72 | A1 |
| (6) |
Notes
The marks for (b) are handwritten on the scheme’s diagram.
(corrected from the printed mark scheme: the handwritten list reads “31, 79” for the Northcliffe end points; the question gives the maximum as 72, as marked on the diagram)
| Scheme | Marks |
|---|---|
| Median of Northcliffe is greater than median of Seaview. Upper quartiles are the same IQR of Northcliffe is less than IQR of Seaview Northcliffe positive skew, Seaview negative skew | B1B1B1 |
| (3) |
Notes
B1B1B1 any 3 acceptable comments
| Scheme | Marks |
|---|---|
| On 75% of the nights that month | B1 |
| both had no more than 52 caravans on site. | B1 |
| (2) | |
| (14 marks) |