
S2 June 2009 Q7
7.
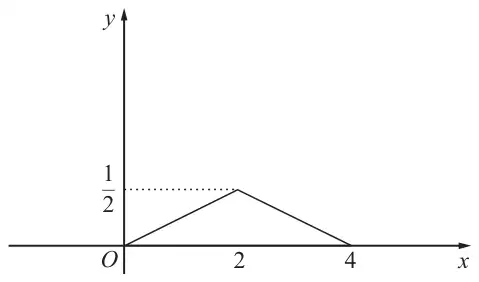
Figure 1 shows a sketch of the probability density function \(\mathrm{f}(x)\) of the random variable \(X\). The part of the sketch from \(x = 0\) to \(x = 4\) consists of an isosceles triangle with maximum at (2, 0.5).
The probability density function \(\mathrm{f}(x)\) can be written in the following form.
\[\mathrm{f}(x) = \begin{cases} ax & 0 \leqslant x \lt 2 \\ b - ax & 2 \leqslant x \leqslant 4 \\ 0 & \text{otherwise} \end{cases}\]| Scheme | Marks |
|---|---|
| \(\mathrm{E}(X) = 2\) (by symmetry) | B1 |
| (1) |
Notes
B1 cao
| Scheme | Marks |
|---|---|
| \(0 \leqslant x \lt 2\), gradient \(= \dfrac{\frac{1}{2}}{2} = \dfrac{1}{4}\) and equation is \(y = \tfrac{1}{4}x\) so \(a = \tfrac{1}{4}\) | B1 |
| \(b - \tfrac{1}{4}x\) passes through (4, 0) so \(b = 1\) | B1 |
| (2) |
Notes
B1 for value of \(a\). B1 for value of \(b\)
| Scheme | Marks |
|---|---|
| \(\mathrm{E}(X^2) = \displaystyle\int_0^2 \left(\tfrac{1}{4}x^3\right)\mathrm{d}x + \displaystyle\int_2^4 \left(x^2 - \tfrac{1}{4}x^3\right)\mathrm{d}x\) | M1M1 |
| \(= \left[\dfrac{x^4}{16}\right]_0^2 + \left[\dfrac{x^3}{3} - \dfrac{x^4}{16}\right]_2^4\) | A1 |
| \(= 1 + \dfrac{64 - 8}{3} - \dfrac{256 - 16}{16} \quad = \quad 4\tfrac{2}{3}\) or \(\tfrac{14}{3}\) | M1A1 |
| \(\mathrm{Var}(X) = \mathrm{E}(X^2) - [\mathrm{E}(X)]^2 = \tfrac{14}{3} - 2^2\ ,\ = \tfrac{2}{3}\) (so \(\sigma = \sqrt{\tfrac{2}{3}} = 0.816\)) (*) | M1 A1cso |
| (7) |
Notes
1st M1 for attempt at \(\displaystyle\int ax^3\) using their \(a\). For attempt they need \(x^4\). Ignore limits.
2nd M1 for attempt at \(\displaystyle\int bx^2 - ax^3\) use their \(a\) and \(b\). For attempt need to have either \(x^3\) or \(x^4\). Ignore limits
1st A1 correct integration for both parts
3rd M1 for use of the correct limits on each part
2nd A1 for either getting 1 and \(3\dfrac{2}{3}\) or awrt 3.67 somewhere or \(4\dfrac{2}{3}\) or awrt 4.67
4th M1 for use of \(\mathrm{E}(X^2) - [\mathrm{E}(X)]^2\) must add both parts for \(\mathrm{E}(X^2)\) and only have subtracted the mean2 once. You must see this working
3rd A1 \(\sigma = \sqrt{\dfrac{2}{3}}\) or \(\sqrt{0.66667}\) or better with no incorrect working seen.
| Scheme | Marks |
|---|---|
| \(\mathrm{P}(X \leqslant q) = \displaystyle\int_0^q \tfrac{1}{4}x\,\mathrm{d}x = \tfrac{1}{4}\), \(\tfrac{q^2}{2} = 1\) so \(q = \sqrt{2} = 1.414\) awrt 1.41 | M1A1,A1 |
| (3) |
Notes
M1 for attempting to find LQ, integral of either part of \(\mathrm{f}(x)\) with their ‘\(a\)’ and ‘\(b\)’ = 0.25
Or their \(\mathrm{F}(x) = 0.25\) i.e. \(\dfrac{ax^2}{2} = 0.25\) or \(bx - \dfrac{ax^2}{2} + 4a - 2b = 0.25\) with their \(a\) and \(b\)
If they add both parts of their \(\mathrm{F}(x)\), then they will get M0.
1st A1 for a correct equation/expression using their ‘\(a\)’
2nd A1 for \(\sqrt{2}\) or awrt 1.41
| Scheme | Marks |
|---|---|
| \(2 - \sigma = 1.184\) so \(2 - \sigma,\ 2 + \sigma\) is wider than IQR, therefore greater than 0.5 | M1,A1 |
| (2) | |
| (15 marks) |
Notes
M1 for a reason based on their quartiles
- Possible reasons are \(\mathrm{P}(2 - \sigma \lt X \lt 2 + \sigma) = 0.6498\) allow awrt 0.65
- 1.184 < LQ(1.414)
NB you must check the reason and award the method mark. A correct answer without a correct reason gets M0 A0