
S2 June 2011 Q3
3.
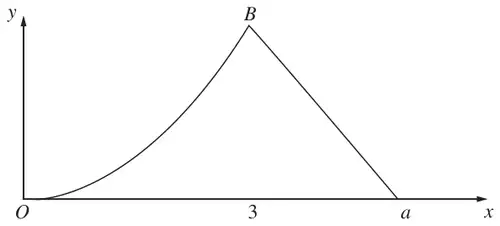
Figure 1 shows a sketch of the probability density function \(\mathrm{f}(x)\) of the random variable \(X\).
For \(0 \leqslant x \leqslant 3\), \(\mathrm{f}(x)\) is represented by a curve \(OB\) with equation \(\mathrm{f}(x) = kx^2\), where \(k\) is a constant.
For \(3 \leqslant x \leqslant a\), where \(a\) is a constant, \(\mathrm{f}(x)\) is represented by a straight line passing through \(B\) and the point \((a, 0)\).
For all other values of \(x\), \(\mathrm{f}(x) = 0\).
Given that the mode of \(X\) = the median of \(X\), find
Without calculating \(\mathrm{E}(X)\) and with reference to the skewness of the distribution
| Scheme | Marks |
|---|---|
| Mode = 3 from graph | B1 |
| (1) |
| Scheme | Marks |
|---|---|
| \(\displaystyle\int_0^3 kx^2\,\mathrm{d}x = 0.5 \ \Rightarrow \left[\frac{kx^3}{3}\right]_0^3 = 0.5\) | M1 A1 |
| So \(\dfrac{27k}{3} - 0 = 0.5 \ \Rightarrow \underline{k = \dfrac{1}{18}}\) (using median = 3) | M1d A1 |
| (4) |
Notes
1st M1 for attempt to integrate f(\(x\)) (need \(x^3\)). Integration must be in part (b)
1st A1 for correct integration. Ignore limits for these two marks.
2nd M1 Dependent on the previous M mark being awarded. For use of correct limits and set equal to 0.5 - leading to a linear equation for \(k\). No need to see 0 substituted.
2nd A1 for \(k = \frac{1}{18}\) or exact equivalent
NB \(k = \frac{1}{18}\) with no working gains M0A0M0A0
\(k = \dfrac{1/2}{9} = \dfrac{1}{18}\) without sight of integration is M0A0M0A0
| Scheme | Marks |
|---|---|
| Height of triangle \(= \dfrac{1}{18} \times 3^2 = \dfrac{1}{2}\) | B1ft |
| Area of triangle \(= \dfrac{1}{2} \times (a - 3) \times \dfrac{1}{2} = \dfrac{1}{2}\) | M1 |
| so \(a = 5\) cao | A1 |
| (3) |
Notes
B1 for correct height of triangle using their \(k\). ie \(9k\). May be seen in working for area of triangle.
Or correct gradient of line ie \(\dfrac{9k}{(3 - a)}\) o.e.
M1 for a correct linear equation for \(a\), in the form \(\pm\dfrac{1}{2} \times (a - 3) \times 9k = \dfrac{1}{2}\) (Must see the halves)
NB if they have stated their height and then used their height rather than \(9k\) allow M1
A1 cao
NB stating a = 5 and then verifying area of the triangle = 0.5 is acceptable.
NB a = 5 on its own is B0M0A0
SC Integration of both parts = 1 or Integration of line = 0.5 leading to \(a^2 - 8a + 15 = 0\) gets B1 M1 and if they identify \(a = 5\) A1
| Scheme | Marks |
|---|---|
| From graph distribution is negative skew (left tail is longer) \(\mu \lt\) median for negative skew so \(\mathrm{E}(X) \lt 3\) [ N.B. \(\mathrm{E}(X) = 2\frac{23}{24}\) ] | B1 B1d |
| (2) | |
| (10 marks) |
Notes
1st B1 for identifying negative skew
2nd B1 dependent on previous B mark being awarded. For correct deduction \(\mathrm{E}(X) \lt 3\)