
C3 January 2010 Q6
6.
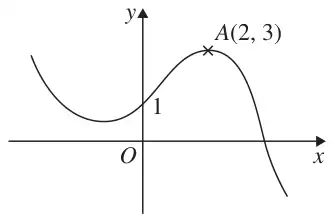
Figure 1 shows a sketch of the graph of \(y = \mathrm{f}(x)\).
The graph intersects the \(y\)-axis at the point \((0, 1)\) and the point \(A(2, 3)\) is the maximum turning point.
Sketch, on separate axes, the graphs of
On each sketch, show the coordinates of the point at which your graph intersects the \(y\)-axis and the coordinates of the point to which \(A\) is transformed. (9)
| Scheme | Marks |
|---|---|
\(y = \mathrm{f}(-x) + 1\)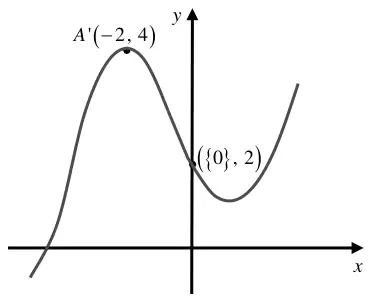 | B1 B1 B1 |
| (3) |
Notes
B1: Shape of

and must have a maximum in quadrant 2 and a minimum in quadrant 1 or on the positive \(y\)-axis.
B1: Either \((\{0\}, 2)\) or \(A'(-2, 4)\)
B1: Both \((\{0\}, 2)\) and \(A'(-2, 4)\)
| Scheme | Marks |
|---|---|
\(y = \mathrm{f}(x + 2) + 3\)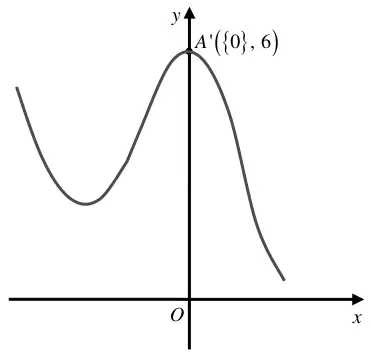 | B1 B1 B1 |
| (3) |
Notes
B1: Any translation of the original curve.
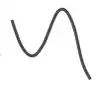
B1: The translated maximum has either \(x\)-coordinate of 0 (can be implied) or \(y\)-coordinate of 6.
B1: The translated curve has maximum \((\{0\}, 6)\) and is in the correct position on the Cartesian axes.
| Scheme | Marks |
|---|---|
\(y = 2\mathrm{f}(2x)\)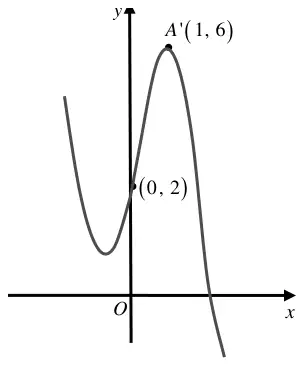 | B1 B1 B1 |
| (3) | |
| (9 marks) |
Notes
B1: Shape of

with a minimum in quadrant 2 and a maximum in quadrant 1.
B1: Either \((\{0\}, 2)\) or \(A'(1, 6)\)
B1: Both \((\{0\}, 2)\) and \(A'(1, 6)\)