
Higher November 2022 Paper 4 Q15
15 The cumulative frequency graph shows the distribution of the ages of the members of a tennis club.
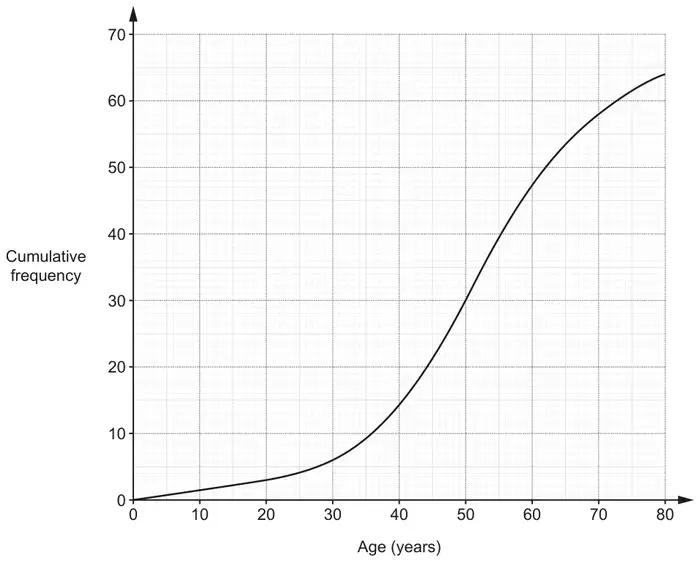
(a) The table summarises the ages of the members of a cycling club.
| Age (a years) | \(0 \lt a \leqslant 20\) | \(20 \lt a \leqslant 30\) | \(30 \lt a \leqslant 40\) | \(40 \lt a \leqslant 50\) | \(50 \lt a \leqslant 70\) | \(70 \lt a \leqslant 80\) |
|---|---|---|---|---|---|---|
| Frequency | 8 | 14 | 8 | 12 | 17 | 5 |
On the graph above, draw the cumulative frequency graph of the ages of the members of the cycling club. [5]
(b) Find out which club has younger members on average.
Give evidence to support your decision. [2]
Give evidence to support your decision. [2]
| Answer | Marks | Part marks and guidance | |
|---|---|---|---|
| Correct cumulative frequency curve | 5 | B2 for 8 22 30 42 59 64 can be implied from plots or M1 for cf calculated with one arithmetic error M2 for accurately plotting these frequencies against the upper group values or M1 for accurately plotting these frequencies against a group value condoning one error B1 for an accurate curve FT their frequencies and dep on increasing frequencies | tolerance for plotting and drawing the curve is ± \(\frac{1}{2}\) small square and ignore curve before (20, 8), if they draw bars award M1 if the bars are the same widths as the groups. |
| Answer | Marks | Part marks and guidance | |
|---|---|---|---|
| cycling and medians [cycling] 40 to 43 [tennis] 51 | 2 | FT their curve for medians providing it is increasing frequencies B1 for one correct median or a statement with one error | See appendix condone a statement which is equivalent and condone tennis median of 50 to 52 and condone ‘average’ for ‘median’ |
Appendix: exemplar responses for Q15(b)
| Response | Mark |
|---|---|
| Cycling + curve is higher for smaller values | 2 |
| Cycling + they have more under 40 | 2 |
| Cycling + have a higher cf at 30 | 2 |
| Cycling + earlier end of graph is higher than tennis | 2 |
| Cycling + the curve for younger members is steeper | 2 |
| Tennis + tennis has less members under the age of 40 | 1 |
| Tennis + tennis curve is below cycling curve for lower ages | 1 |
| Tennis + tennis curve is less steep for lower ages | 1(BOD) |
| Tennis + its curve is below the other one | 1(BOD) |
| anything to do with spread | 0 |