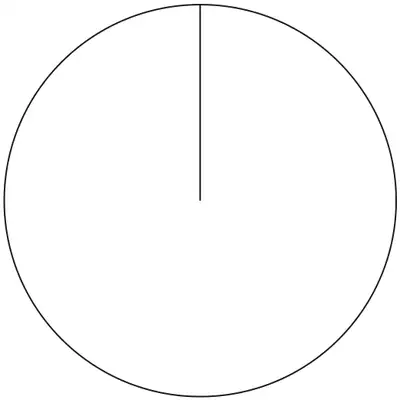
(a) The table shows the results for a sports club’s ‘A’ team.
Result
Frequency
Win
18
Draw
10
Lose
12
Total
40
Complete a labelled pie chart to show these results.
[4]
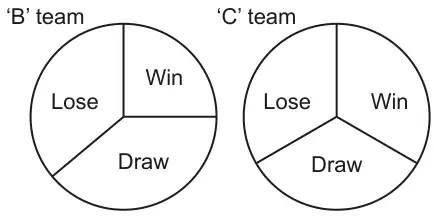
(b) Here are the results for the sports club’s ‘B’ team and ‘C’ team.
The ‘C’ team manager says
The pie charts show that the ‘C’ team won more games than the ‘B’ team.
Referring to the pie charts, explain why the ‘C’ team manager may not be correct. [1]
Mark scheme (a)
Answer
Marks
Part marks and guidance
a correct labelled pie chart with ruled lines
4
B3 for a correct unlabelled/incorrectly labelled pie chart with ruled lines OR B2 for 162, 90 and 108 or for two sectors within tolerance of \(\pm 2^\circ\) ignore label or M1 for \(\frac{360}{40}\) or 9 OR B1 for one sector within tolerance ignore label
Correct means three sectors must be within tolerance of \(\pm 2^\circ\) for B3 and 4 marks
Do not accept frequency alone as labels
May be seen in working, alongside table or on pie chart
Note : maximum of 3 sectors for B3, B2 and B1
Mark scheme (b)
Answer
Marks
Part marks and guidance
The pie charts do not show how many matches were played by each team
1
Accept any correct reason see appendix if more than one statement mark the best as long as it is not contradicted or has an incorrect statement
Appendix
Exemplar responses for Q18b
Response
Mark
They may have played less/more matches in total
1
We don’t know how many games were played
1
The pie charts do not show how many matches were played by each team
1
B team could have played more games (or less)
1
C team may have played more games (or less)
1
They could have played a different number of games
1
They(C) may have played less matches in total
1
Pie charts do not show the actual figures (raw data)
1
Pie charts only show proportion
1
Bigger fraction might not reflect a bigger quantity
1
The numbers in B team may be higher than the numbers in C team ( charts are labelled B team and C team)
1
No numbers so it could be correct or not we wouldn’t know.
1
They do not know how many games B played
0
They do not know how many games C played
0
The total frequency is not given
0
The frequency may not be the same for both ( frequency of what?)
0
It depends on how many times C wins
0
The information (or data) is not shown
0
We do not know the exact values
0
You can’t guarantee everything will be equal
0
It might not be accurate
0
He can’t tell accurately how many games were won
0
It depends on how many matches B plays (doesn’t refer to both teams)
0
It depends on how many matches C plays (doesn’t refer to both teams)