
Foundation June 2024 Paper 2 Q26
26 In a survey, 50 people were asked whether they have a car (C) or a bicycle (B).
The Venn diagram shows some of the results.
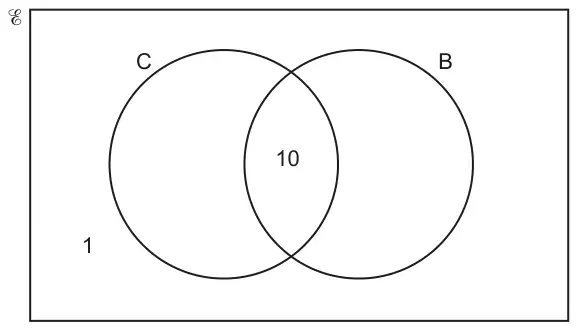
The ratio of those that only have a car to those that only have a bicycle is 2 : 1.
One of the 50 people is chosen at random.
Find the probability that they have a bicycle.
You must show your working. [5]
| Answer | Marks | Part marks and guidance | |
|---|---|---|---|
| \(\frac{23}{50}\) oe with correct working | 5 | Correct working requires evidence of at least M1M1A1 isw conversion/cancelling after correct answer seen Do not accept ratio or words All method marks may be seen on Diagram | |
| M1 for \(50 - 10 - 1\) M1 for their \(39 \div (2 + 1)\) A1 for 13 or 26 | M1 implied by 39 M1 implied by 13 Repeated addition/subtraction see appendix 26:13 or 13:26 implies M1M1A1 | ||
| AND B1 for answer \(\frac{23}{k}\) or answer \(\frac{p}{50}\) | Where \(k \gt 23\) and an integer Where \(p \lt 50\) and a positive integer | ||
| If 0 or 1 scored, instead award SC2 for answer of \(\frac{23}{50}\) oe | Algebraic method see Appendix 5 | ||
Appendix
APPENDIX 5 Question 26
Algebraic method
Allow any 2 different letters to represent ‘only car’ and ‘only bike’.
M1 \(b + c = 39\) or \(2c = b\)
M1 \(3c = 39\) or \(3b = 78\)
A1 \(b = 26\) or \(c = 13\)
AND
B1 for answer \(\frac{23}{k}\) or answer \(\frac{p}{50}\)
Repeated Addition/Subtraction Methods
This is when division is attempted by listing multiples of a number or by repeated subtraction.
e.g. \(3000 \div 400\)
Repeat Addition: 400, 800, 1200, 1600, 2000, 2400, 2800, [3200]
When marking this we need to see at least 3 correct multiples, one of these MUST be the number before reaching the value, in this case 2800.
We allow ONLY one arithmetic error in this method (unless the mark scheme states otherwise)
Example 1:
400, 800, 1100 (error), 1500, 1900, 2300, 2700, [3100] – one arithmetic error, but correct FT from the error so M1 awarded.
Example 2:
400, 800, 1100 (error), 1500, 1800 (error), 2200, 2600, [3000] – two arithmetic errors, so M0 awarded.
e.g. \(400 \div 60\)
Repeat Subtraction: 400, 340, 280, 220, 160, 100, 40, [\(-20\)]
When marking this we need to see at least 3 correct subtractions, one of these MUST be the number before reaching 0.
We allow ONLY one arithmetic error in this method (unless the mark scheme states otherwise)
Example 1:
400, 340, 280, 200 (error), 140, 80, 20, [\(-40\)] – one arithmetic error, but correct FT from the error so M1 awarded.
Example 2:
400, 320(error), 260, 210 (error), 150, 90, 30, [\(-30\)] – two arithmetic errors, so M0 awarded.