
Foundation June 2022 Paper 2 Q11
11 Some students were asked how they travel to school.
Each student gave one answer.
The pie chart shows the proportion who travel by bus, by train or walk.
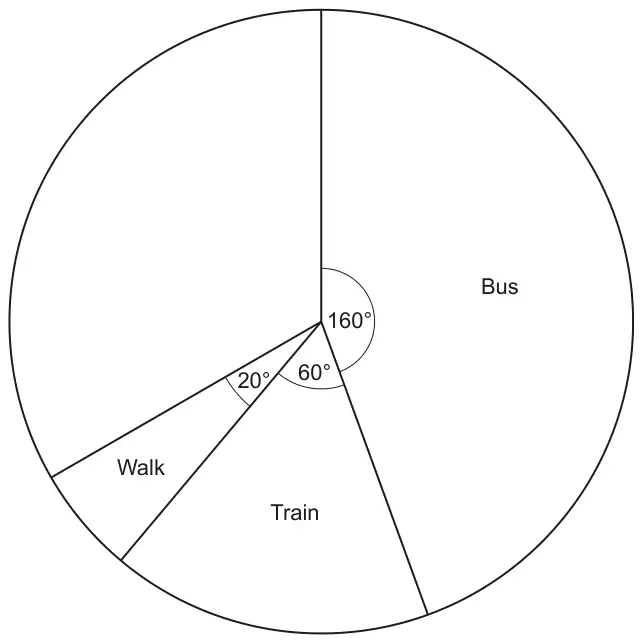
(a) All of the remaining students travel to school either by bike or by car.
The ratio of the number who travel by bike to the number who travel by car is 2 : 3.
The ratio of the number who travel by bike to the number who travel by car is 2 : 3.
Complete the pie chart.
You must show your working. [6]
(b) Which way of travelling to school is the mode? [1]
| Answer | Marks | Part marks and guidance | |
|---|---|---|---|
| Correct, labelled pie chart with correct working | 6 | “correct working” requires at least M1M1 and ruled line If there are labelled angles, mark the method that leads to the angles If angles are not shown mark worst method | |
| M2 for \(360 - (160 + 60 + 20)\) oe or M1 for \(160 + 60 + 20\) AND | May be implied by 120 May be implied by 240 | ||
| M1 for \(\dfrac{2}{5} \times\) their 120 oe A1 for 48 or M1 for \(\dfrac{3}{5} \times\) their 120 oe A1 for 72 AND | Mark to the candidate’s advantage Their \(120 \lt 360\) 48 implies M1A1 72 implies M1A1 | ||
| B1 for ruled line at \(48^\circ\) B1 for their smaller sector labelled “bike” and larger sector labelled “car” | Tolerance \(\pm 2^\circ\) only if correct working seen. | ||
| Answer | Marks | Part marks and guidance | |
|---|---|---|---|
| Bus | 1 | ||