
Foundation June 2023 Paper 3 Q12
12 A school has 540 students.
This pie chart shows the way that all 540 students travel to the school.
Each student either walked or cycled or travelled by bus or travelled by car.
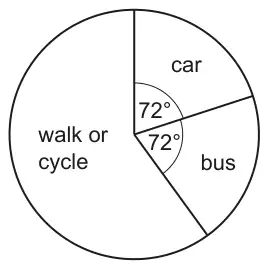
(a) Work out how many of the 540 students travel to the school by car. [3]
(b) The number of students who walk is three times the number who cycle.
Work out the sector angle for the students who walk to school.
You do not need to draw this on the pie chart. [3]
| Answer | Marks | Part marks and guidance | |
|---|---|---|---|
| 108 | 3 | M2 for \(\dfrac{72}{360} \times 540\) oe or M1 for \(\dfrac{72}{360}\) oe or \(\dfrac{540}{360}\) oe | May be e.g. \(72 \div \dfrac{360}{540}\) or \(72 \div 0.66\) to 0.67 or \(540 \div 5\) Implied by e.g. \(\dfrac{1}{5}\) or 5 or 0.2 or 20% or e.g. 1.5 or 0.66 to 0.67 accept Inverse \(\dfrac{360}{72}\) or \(\dfrac{360}{540}\) accept \(360 \times x = 72 \times 540\) for M1 where \(x\) is any variable or 216 [students] NOT from 360 – 72 – 72 |
| Answer | Marks | Part marks and guidance | |
|---|---|---|---|
| 162 | 3 | M2 for \(\dfrac{3}{4} \times (360 - 2 \times 72)\) oe OR M1 for \(\dfrac{3}{4} \times [\ \ \ ]\) oe or B1 for 216 | or \(\dfrac{3}{4} \times (540 - 2 \times\) their \(108) \times \dfrac{360}{540}\) oe e.g. 540 – 216 (= 324) \(\rightarrow 324 \div 4\) (= 81) \(\rightarrow 324 - 81\) (= 243) \(\rightarrow 243 \times \dfrac{360}{540}\) or \(243 \div \dfrac{540}{360}\) or \(243 \div 1.5\) NB \(\dfrac{360}{540} = \dfrac{2}{3}\) and the inverse is often 1.5 [ ] \(\lt 540\) |