
Higher November 2019 Paper 6 Q15
15 The histogram shows information about the weights of some of the parcels handled by a delivery company in one month.
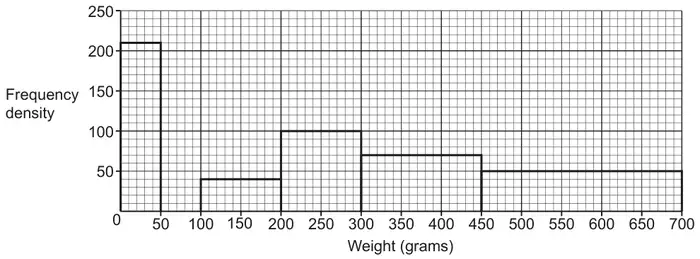
(a) Zoe says
There are fewer parcels weighing between 450 g and 700 g than parcels weighing between 300 g and 450 g.
Is Zoe correct?
Show how you decide. [4]
(b) The delivery company delivered 6500 parcels weighing between 50 g and 100 g.
Complete the histogram to show this information. [2]
(c) Zoe uses the histogram to calculate the number of parcels weighing between 200 g and 250 g.
Explain why Zoe’s answer is unlikely to be reliable. [1]
| Answer | Marks | Part marks and guidance | |
|---|---|---|---|
| e.g. 300-450: 150 × 70 = 10 500 [parcels] 450-700: 250 × 50 = 12 500 [parcels] [Zoe is] not correct oe | 4 | M2 for 150 × 70 and 250 × 50 or M1 for 150 × 70 or 250 × 50 AND A1 for 10 500 or 12 500 AND A1 10 500 and 12 500 and conclusion Alternative method, for example: M1 for 150 × 70 soi by 10 500 A1 for 10 500 AND M1 for their 10 500 ÷ 250 A1 for height of 450-700 bar is more than 42 so Zoe is not correct If 0 scored then SC2 for 10 500 and 12 500 with no method shown or SC3 for 10 500 and 12 500 with no method shown and correct conclusion | For full marks, calculations must be shown, together with a conclusion. Allow other equivalent methods involving consistent area calculations. |
| Answer | Marks | Part marks and guidance | |
|---|---|---|---|
| Bar of height 130 drawn for 50-100g | 2 | M1 for 6500 ÷ 50 soi by 130 | |
| Answer | Marks | Part marks and guidance | |
|---|---|---|---|
| The weights of parcels may not be evenly distributed [between 200g and 300g] oe | 1 | e.g. uneven distribution of weights | |