
Higher November 2019 Paper 4 Q19
19 The graph shows the distance travelled by a particle over 8 seconds.
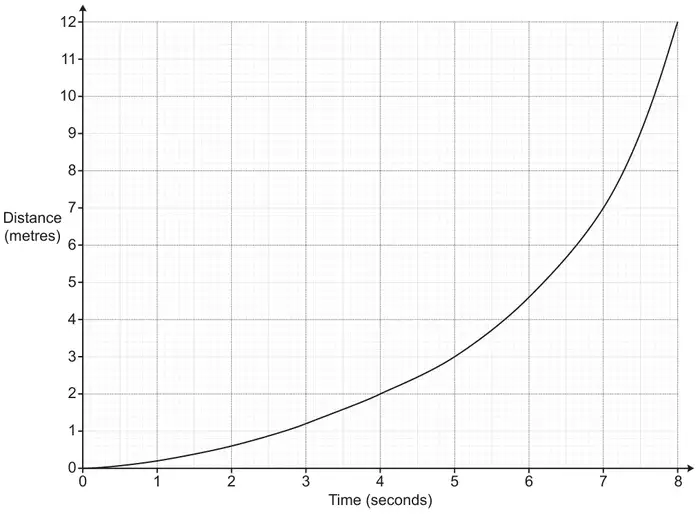
Estimate the speed of the particle at 5 seconds. [4]
| Answer | Marks | Part marks and guidance | |
|---|---|---|---|
| 1.0 to 1.4 dep. on a tangent drawn | 4 | B3 for an answer within the given range with a slightly inaccurate tangent, i.e. touches curve in range \(t\) = 4.5 to 5.5 but not at \(t\) = 5 or an answer of 1.3 using a symmetric chord about \(t\) = 5 e.g. from (4, 2) to (6, 4.6). OR B2 for an answer from using a symmetric chord about \(t\) = 5, e.g. from (4, 2) to (6, 4.6), with at most one error OR M1 for an attempt to draw a tangent touching curve at \(t\) = 5 and M2 for their distance ÷ their time e.g. (7.4 – 1.2) ÷ (8 – 3) or M1 for an attempt at their distance ÷ their time with one error or a correct attempt to find the gradient of their line which is not a tangent e.g. line from (0, 0) to (5, 3) which gives the average speed of \(\frac{3}{5}\) or 0.6 | Note: 5 ÷ 3 = 1.66… scores 0 |