
Higher November 2020 Paper 6 Q1
1 A travel agent records the duration and cost of the 15 flights he sold on one day.
The data for the first 13 flights are plotted on the scatter diagram.
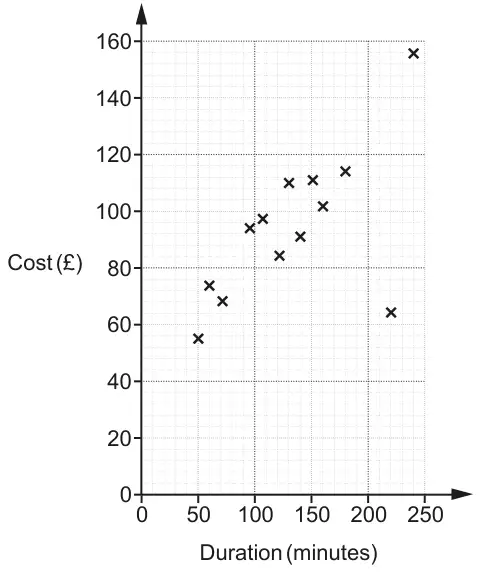
(a) The data for the final two flights is:
| Duration | 210 minutes | 1 hour 40 minutes |
|---|---|---|
| Cost | £130 | £80 |
Plot these flights on the scatter diagram. [2]
(b) The cost of one of the 15 flights had been discounted in a sale.
Circle the most likely flight on the scatter diagram. [1]
(c)
(i) Draw a line of best fit on the scatter diagram. [1]
(ii) Use your line of best fit to estimate the duration of a flight costing £90. [1]
(d) Explain why the travel agent should not use his records to estimate the cost of a 7 hour flight. [1]
| Answer | Marks | Part marks and guidance | |
|---|---|---|---|
| Points plotted at (210, 130) and (100, 80) | 2 | B1 for 100 soi or for one point plotted correctly | Half square tolerance May be implied by point plotted at duration 100 |
| Answer | Marks | Part marks and guidance | |
|---|---|---|---|
| Point at (220, 64) circled | 1 | ||
| Answer | Marks | Part marks and guidance | |
|---|---|---|---|
| (i) Ruled line of best fit drawn | 1 | Use overlay anchored on top right point Line must reach to edges of overlay | |
| (ii) Their line used to give duration for £90 ± 5 minutes | 1 FT | Strict FT from their intended straight line of best fit | NB read (\(n\), 90) not (90, \(n\)) |
| Answer | Marks | Part marks and guidance | |
|---|---|---|---|
| [7 hours is] is beyond the given data oe | 1 | Accept eg the trend may not continue | |
Appendix: Q1(d)
| Response | Mark | |
|---|---|---|
| No because it does not have a record for 7 hours | This scores 0 as there is no record for e.g. 80 min. Must imply “beyond” | 0 |
| 7 hours isn't on the scale. | No. Implies a bigger diagram would be OK | 0 |
| No Because 420 minutes is too long to fit on the graph | Implies it would be OK with a bigger graph | 0 |
| No It only shows 2h 50 minutes | Suggests 7 hours is a missing value | 0 |
| No It would go up to 4200. | No implies scale not long enough | 0 |
| No Highest duration is 250 mins which isn't 7 hours. 420 mins is 7 hours. | No. Implies a bigger diagram would be OK | 0 |
| No His records only go up to 4hours 10minutes. | No. This is about the scale. However, if they had said 4 hours, then they would have been talking about the data | 0 |
| No It does not show this information. 7x60 = 420mins. Graph only goes up to 250mins. | No scale again | 0 |
| No His record doesn't show any 7 hour flights. | No. Implies it is a missing value | 0 |
| No It would not fit on the graph. | No. Implies it is a missing value | 0 |
| No Duration only goes to 250 mins. | No. Implies it is a missing value | 0 |
| No Graph does not go beyond 250 minutes. 60x7 = 420mins. | No. Implies it is a missing value | 0 |
| No Duration does not go up to 7 hours. | No. Implies a bigger diagram would be OK | 0 |
| No Extrapolation | Not explained | 0 |
| No. Should not extrapolate beyond 250 minutes/the graph | Graph not big enough | 0 |
| No. Extrapolating too far meaning his estimate would be inaccurate | Not quite sufficiently clear. What is “too far” and is it from 240 or 250? | 0 |
| No. The data only shows a maximum of a 250 minute flight so this would be unreliable | Contradiction. 240 rather than 250 would have been acceptable. | 0 |
| No There are only less amount of flights on the diagram. | Yes. This implies “beyond the data” | 1 |
| No because the duration only goes up to 240 minutes | Scores the mark for implying beyond the data | 1 |
| No because it does not have records that go as far as 7 hours. | This is OK as it implies “beyond” | 1 |
| No. Should not extrapolate beyond 240 minutes/the data | Beyond the data | 1 |