
Higher November 2020 Paper 4 Q9
9 The graph shows the number of umbrellas sold in Ling’s shop for each quarter from quarter 1 of 2017 to quarter 3 of 2019.
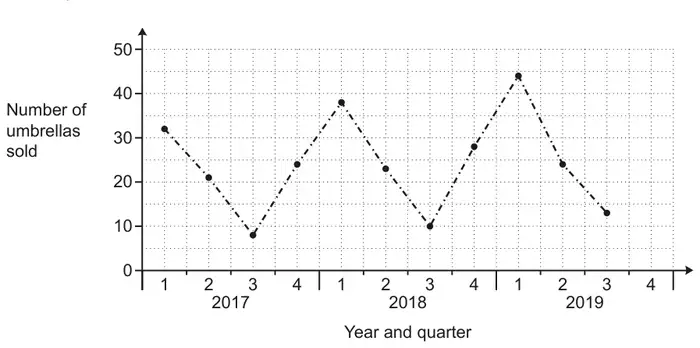
(a) The shop sold 32 umbrellas in quarter 4 of 2019.
Complete the graph. [1]
(b) Make one comment about the seasonal variation shown in this graph. [1]
(c) Make one comment about the annual variation shown in this graph. [1]
(d) Ling predicts that she will sell 50 umbrellas in quarter 1 of 2020.
What assumption has she made? [1]
| Answer | Marks | Part marks and guidance | |
|---|---|---|---|
| Point accurately plotted and line drawn | 1 | for the ‘4’ mark intent and 32 must lie between 30 and 35 and not on the lines, condone solid/dotty line | |
| Answer | Marks | Part marks and guidance | |
|---|---|---|---|
| Correct comment e.g. it peaks in Q1 or the lowest is in Q3 | 1 | Condone winter/spring for Q1 and summer/autumn for Q3 and in (b)(c)(d) mark best comment unless contradictory | |
Appendix: Exemplar responses for Q9(b)
| Response | Mark |
|---|---|
| Number sold in the Q1 is the highest | 1 |
| Number sold in the Q3 is the lowest | 1 |
| Sales decreased after Q1 and increased after Q3 | 1 |
| Goes down then goes up | 0 |
| Sales decreased during Q1 and increased during Q3 | 0 |
| Sales increase in Q1 each year | 0 |
| Answer | Marks | Part marks and guidance | |
|---|---|---|---|
| Correct comment e.g. there is a slight rise in sales year on year | 1 | ||
Appendix: Exemplar responses for Q9(c)
| Response | Mark |
|---|---|
| Slight rise year to year | 1 |
| As years went on more umbrellas are sold | 1 |
| More sold in 2019 than in recent/previous years | 1 |
| Answer | Marks | Part marks and guidance | |
|---|---|---|---|
| The trend in her sales will continue [at a similar rate] oe | 1 | Accept any correct relevant comment referring to general trend or quarter 1 trend isw extra statements | |
Appendix: Exemplar responses for Q9(d)
| Response | Mark |
|---|---|
| The trend year to year will continue | 1 |
| The shop remains in business | 1 BOD |
| Q1 increases by the same amount each year | 1 |
| Graph will follow the same pattern | 1 |
| More are sold in the first quarter | 0 |
| It will rain more in 2020 | 0 |