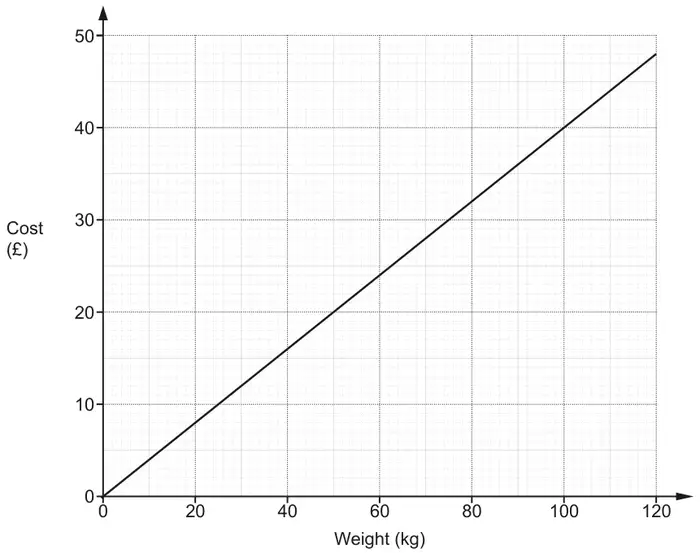
5 This graph shows the cost of buying potatoes from a farm.
(a)
(i) How much does it cost to buy 70 kg of potatoes? [1]
(ii) What weight of potatoes can be bought for £38? [1]
(iii) The cost per kilogram of potatoes is the same for any weight of potatoes.
How much will it cost to buy 180 kg of potatoes from the farm? [3]
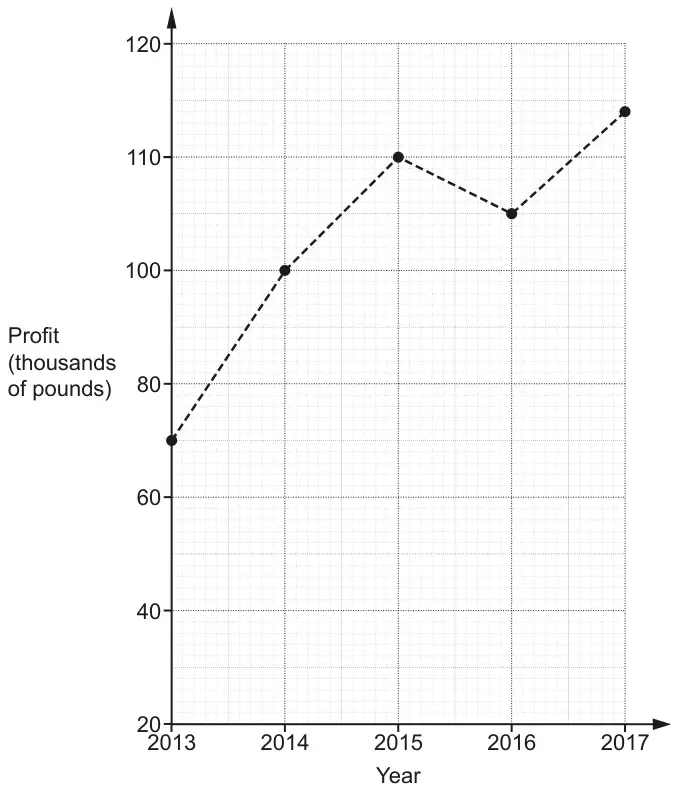
(b) This graph shows the annual profits, in thousands of pounds, of the farm between 2013 and 2017.
Describe one misleading feature of the graph. [1]
Mark scheme (a)
Answer
Marks
Part marks and guidance
(i) 28
1
Allow ±0.50
(ii) 95
1
Allow ±1
(iii) 72
3
Allow ±2 B1 for 1kg costs £0.40 soi M1their 0.4 \(\times\) 180 or their cost \(\times \dfrac{180}{\textit{their}\ \text{equivalent weight}}\) or M1 for finding costs of weights that sum to 180 kg M1 for addition of these costs
e.g. 10kg costs £4
e.g. 4 x \(\dfrac{180}{10}\)
Note: award M2 for e.g. cost of 60 kg \(\times\) 3 attempted
Mark scheme (b)
Answer
Marks
Part marks and guidance
one valid reason
1
Such as ‘the vertical scale is not linear’
e.g. vertical scale is wrong vertical scale does not start from 0