
Foundation June 2019 Paper 3 Q10
10 The pie chart shows how Jack spent his time one evening.
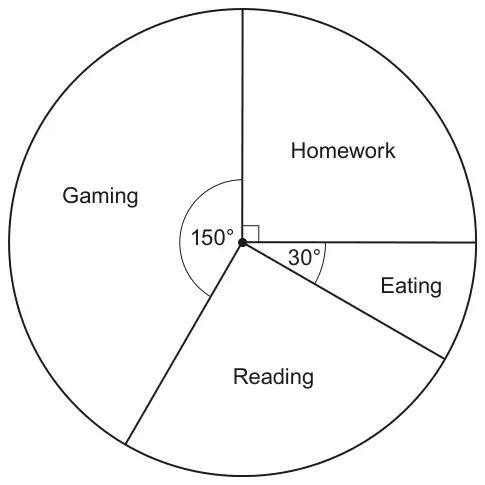
(a) On which activity did Jack spend most time? [1]
(b) Jack says
I spent \(\dfrac{1}{3}\) of my time on Gaming.
Show that he is not correct. [2]
(c) The pie chart represents 5 hours.
Find the time, in hours and minutes, that Jack spent reading. [4]
| Answer | Marks | Part marks and guidance | |
|---|---|---|---|
| Gaming | 1 | ||
| Answer | Marks | Part marks and guidance | |
|---|---|---|---|
| A correct calculation or \(\dfrac{150}{360}\) oe or \(\dfrac{360}{150}\) oe | M1 | \(150 \div 360\) or \(360 \div 150\) or \(360 \div 3\) or \(\dfrac{1}{3}\) of 360 or \(150 \times 3\) | For M1 oe is equivalent fraction eg \(\dfrac{5}{12}\) |
| Justify rejecting Jack’s assertion | A1 | Must be comparison between
| Match answer to calculation or statement \(\dfrac{150}{360}\) oe and \(\dfrac{1}{3}\) oe with common denominator or 0.4[...] and 0.3[...] or 2.4 and 3 or their 450 and 360 See appendix |
Appendix
Question 10b
| Response | Mark | |
|---|---|---|
| A | \(\dfrac{1}{3} \times 360 = 120\) and he has done 150 which is more than that | 2 Correct calculation for M1 and A1 recognises 150 is not 120 |
| B | Jack’s incorrect as \(\dfrac{1}{3}\) of 360 is 120 and he has done 150 | 2 Correct statement of a third of 360 for M1 and A1 recognises 150 is not 120 |
| C | \(360 \div 150 = 2.4\) | 1 Correct calculation (\(360 \div 150\)) for M1 but A0 as no comparison of 2.4 with 3 |
| D | \(\dfrac{1}{3} \times 360 = 120\). The angle is supposed to be 120 if he spent a third. | 1 Correct calculation (\(\dfrac{1}{3} \times 360\)) for M1 but A0 as no mention of 150 |
| E | \(\dfrac{150}{360} = \dfrac{5}{12}\) which is more than \(\dfrac{1}{3}\) | 1 Correct fraction (\(\dfrac{150}{360}\)) for M1 but A0 as no common form to compare fractions |
| F | She is incorrect as \(3 \times 150 = 450\). | 1 Correct calculation for M1 A0 as no comparison with 360 |
| G | As 150 angle is not equivalent to a third | 0 True but no \(150 \times 3\) or \(360 \div 3\) to support so M0 |
| H | The gaming angle is 150 that’s nearly half of his time | 0 No calculation so M0 |
| Answer | Marks | Part marks and guidance | |
|---|---|---|---|
| 1 [h] 15[min] | 4 | B3 for 1.25 [hours] or \(1\dfrac{1}{4}\) [hours] or 75 [minutes] OR B1 for [Reading =] 90 M2 for (5 or 300) \(\times \dfrac{\text{their } 90}{360}\) oe or (5 or 300) \(\div \dfrac{360}{\text{their } 90}\) or B1 for \(\dfrac{\text{their } 90}{360}\) soi \(\dfrac{1}{4}\) or \(\dfrac{360}{\text{their } 90}\) soi 4 | Working may be in hours or minutes May be seen on diagram. Allow symbol oe M2 for (5 or 300) \(\div\) 4 |
Notes
Alternative methods
| M1 for [150 + 30 =] 180 M1 for (5 or 300) \(\div\) 2 M1 for their (5 or 300) \(\div\) 2 \(\div\) 2 | B1 for [reading =] 90 M1 for \(360 \div 5\) soi 72 M1 for \(90 \div\) their \((360 \div 5)\) | B1 for [reading =] 90 M1 for \(300 \div 360\) or \(360 \div 300\) M1 for their \((300 \div 360) \times 90\) or \(90 \div\) their \((360 \div 300)\) |