
Higher June 2022 Paper 5 Q12
12 An athlete goes for a training run.
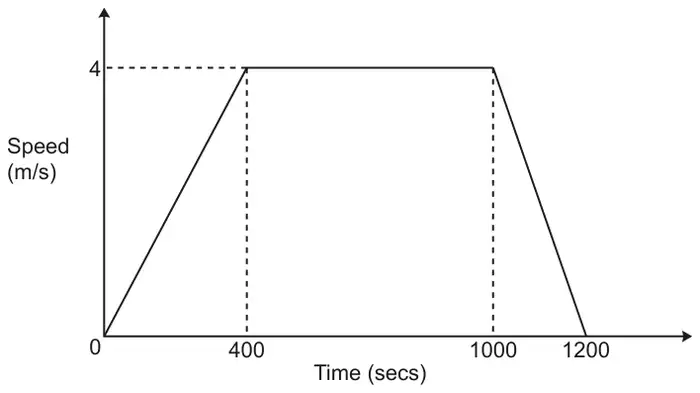
The graph shows their speed as they run.
Not to scale
(a) Write down the athlete’s acceleration between 400 seconds and 1000 seconds. [1]
(b) Work out the athlete’s average speed, in m/s, during the 1200 seconds.
You must show your working. [5]
You must show your working. [5]
| Answer | Marks | Part marks and guidance | |
|---|---|---|---|
| 0 | 1 | ||
| Answer | Marks | Part marks and guidance | |
|---|---|---|---|
| 3 with correct working | 5 | “correct working” requires at least M3 | |
| M3 for method for three areas correct or for 3600 or 800 and 2400 and 400 nfww or M2 for method for two areas correct (method towards two from 800, 2400, 400) or M1 for method for one area correct (method towards 800 or 2400 or 400) or for 2400 seen AND M1dep for their 3600 ÷ 1200, dep on at least M2 | Treat as three separate areas, so trapezium from 0 to 1200 is three areas, trapezium from 0 to 1000 is 2 areas, trapezium from 400 to 1200 is 2 areas. For M marks, mark method not accuracy, so M1 for \(\frac{400 \times 4}{2}\) even if not evaluated as 800. | ||
| If 0 or 1 scored instead award SC2 for 3 with no or insufficient working but not from wrong working | |||