
Foundation November 2017 Paper 2 Q10
10 This pie chart shows how the employees of a business travel to work.
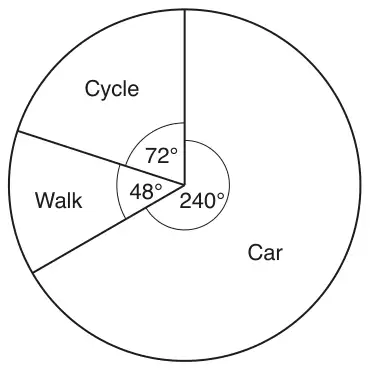
Not to scale
(a) Find the ratio of the number of employees who cycle to work to the number of employees who walk to work.
Give your answer in its simplest form. [2]
(b) 80 employees travel to work by car.
Work out the number of employees who cycle to work and the number of employees who walk to work. [3]
| Answer | Marks | Part marks and guidance | |
|---|---|---|---|
| 3 : 2 or 1.5 : 1 or 1 : \(\dfrac{2}{3}\) | 2 | M1 for 72 : 48 oe or SC1 for 2 : 3 or 1 : 1.5 or \(\dfrac{2}{3}\) : 1 | For 2 marks or SC1 do not isw |
| Answer | Marks | Part marks and guidance | |
|---|---|---|---|
| [cycle =] 24 [walk =] 16 | 3 | M1 80 employees to 240° equivalent to 1 employee to 3° soi or for cycle + walk = 40 soi M1 for \(\dfrac{48}{\textit{their } 3}\) or \(\dfrac{72}{\textit{their } 3}\) soi or attempt to divide 40 employees in the ratio 72 : 48 | eg 240 \(\div\) 80 One answer correct or correct answers reversed implies M1M1 |