Tolerance ½ square Award the markers even if not correctly representing the information eg if 17000 is plotted at 68000 still credit the markers at 28000, 37000 etc.
Mark scheme (d)
Answer
Marks
Part marks and guidance
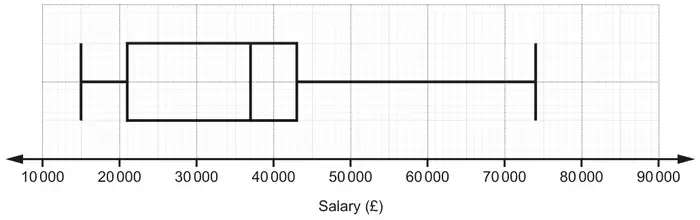
Interquartile range is the same for both oe or Range for CC is higher oe
1
IQR = 22 000 for both
BB range = 59 000 CC range = 68 000
Average/median salaries are the same or The middle 50% of salaries for CC are higher
1
Medians = 37 000 for both
When given, figures should be correct.
Ignore additional incorrect comparisons provided they do not contradict a correct answer given
Do not accept comments just about a max (or min) salary B0 for CC has the highest salary B0 for highest paid worker at CC earns more than highest paid worker at BB B0 (some) people earn more at CC B0 for wider distribution at CC