
Higher June 2018 Paper 6 Q8
8 The graph shows the speed of a tram as it travels from the library to the town hall.
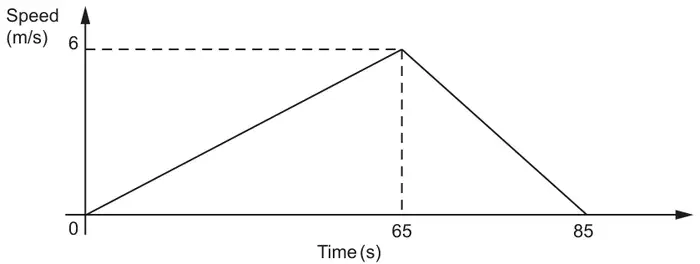
Not to scale
(a) Calculate the deceleration of the tram as it approaches the town hall. [2]
(b) Calculate the distance travelled by the tram between the library and the town hall. [3]
(c) What was the maximum speed of the tram as it travelled between the library and the town hall?
Give your answer in kilometres per hour. [4]
Give your answer in kilometres per hour. [4]
| Answer | Marks | Part marks and guidance | |
|---|---|---|---|
| 0.3 oe | 2 | M1 for \(\dfrac{[\pm]6}{85 - 65}\) oe or answer −0.3 If 0 scored, allow SC1 for 0.092[3…] or \(\dfrac{6}{65}\) as final answer | Allow unsimplified equivalents for full marks eg. \(\dfrac{6}{20}\) |
| Answer | Marks | Part marks and guidance | |
|---|---|---|---|
| 255 | 3 | M2 for valid method to find complete area under the graph using one or more parts OR M1 for attempt to find partial area below the graph | M2 examples: eg \(\dfrac{85 \times 6}{2}\) oe or two triangles soi by 195 and 60 or [rectangle] 6 × 85 – two triangles oe M1 examples a triangle between \(t\) = 0 and 65 or a triangle between \(t\) = 65 and 85 or [rectangle] 6 × 85 – one triangle M0 for [rectangle] 6 × 85 Allow full marks for equivalent with units stated eg. 0.255 km |
| Answer | Marks | Part marks and guidance | |
|---|---|---|---|
| 21.6 or \(\dfrac{108}{5}\) or \(21\frac{3}{5}\) nfww | 4 | B1 for 6 soi AND M2 for \(\dfrac{\textit{their } 6 \times 60 \times 60}{1000}\) oe or M1 for their 6 × 60 × 60 oe soi 21 600 or their 6 ÷ 1000 oe soi 0.006 or \(\dfrac{60 \times 60}{1000}\) oe soi 3.6 | Condone missing or incorrect units in working eg 6 m for 6 m/s their 6 could be the average speed 255/85 21600 or 0.006 imply B1M1 |