
Higher November 2018 Paper 5 Q15
15 The cumulative frequency graph shows information about the marks scored by a group of 80 students in a test.
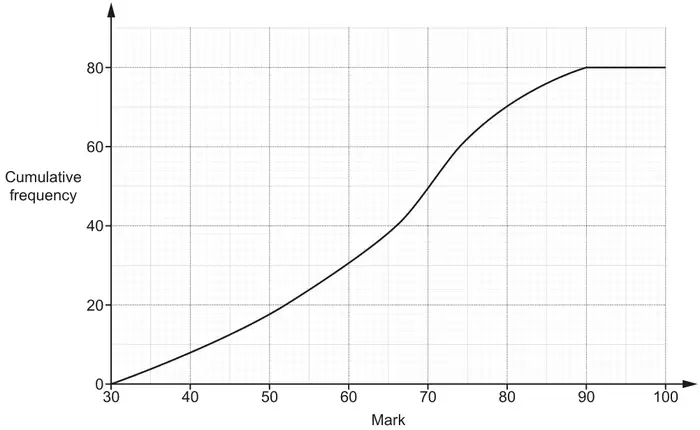
(a) Find the interquartile range. [2]
(b) The ratio of the number of students passing the test compared to failing the test is 4 : 1.
Find the minimum mark needed to pass the test. [3]
Find the minimum mark needed to pass the test. [3]
| Answer | Marks | Part marks and guidance | |
|---|---|---|---|
| 22 | 2 | B1 for [UQ =] 74 or [LQ =] 52 | e.g. answer 74 alone scores B0 |
| Answer | Marks | Part marks and guidance | |
|---|---|---|---|
| 48 to 49 | 3 | B2 for 16 seen or M1 for 80 ÷ (4 + 1) | For B2 accept 16/80 |