
Higher November 2018 Paper 5 Q8
8 The table shows the number of computers sold in Tom’s shop each quarter from 2015 to 2017.
| 2015 | 2016 | 2017 | ||||||||||
|---|---|---|---|---|---|---|---|---|---|---|---|---|
| Quarter | 1 | 2 | 3 | 4 | 1 | 2 | 3 | 4 | 1 | 2 | 3 | 4 |
| Number of computers sold | 13 | 31 | 29 | 45 | 20 | 32 | 25 | 47 | 27 | 40 | 30 | 58 |
(a) Complete this graph using the information for 2017.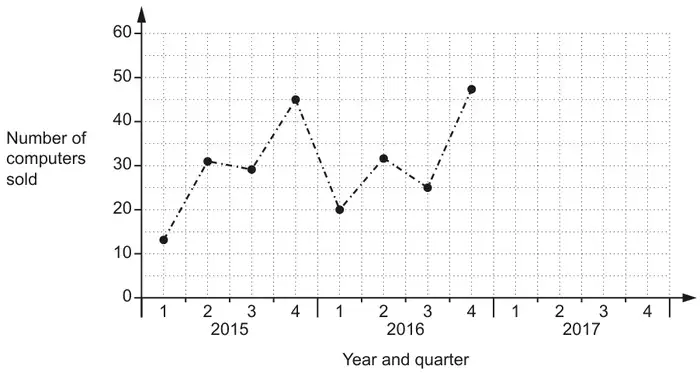
[2]
(b) Tom adds the three results for quarter 1 and he adds the three results for quarter 4.
Tom says
The ratio of the total number of computers sold in quarter 1 compared to quarter 4 is 2 : 5.
Is he correct?
Show your reasoning. [2]
(c) Make two comments about Tom’s sales over the period 2015 to 2017. [2]
(d) Tom predicts that he will sell more than 60 computers in the 4th quarter of 2018.
What assumption has he made? [1]
| Answer | Marks | Part marks and guidance | |
|---|---|---|---|
| Correctly completes graph | 2 | B1 for 2 or 3 correct plots or for 4 plots at correct height | Use overlay, mark in 60% zoom For 2 marks, condone points not joined |
| Answer | Marks | Part marks and guidance | |
|---|---|---|---|
| He is correct oe with 60 and 150 shown [= 2 : 5] | 2 | M1 for 13 + 20 + 27 oe or 45 + 47 + 58 oe | |
| Answer | Marks | Part marks and guidance | |
|---|---|---|---|
| Correct overall comment | 1 | i.e. increasing oe | isw extra statements |
| Correct seasonal comment | 1 | e.g. [Sales were] weakest in 1st quarter [Sales were] strongest in 4th quarter | See AG isw extra statements |
Appendix: exemplar responses for Q8(c)
| Response | Mark |
|---|---|
| He sells more at the end of the year He always sells the least at the start of the year | Seasonal 1 Overall 0 |
| Tom sells more in the 4th quarter each year. Tom sold more in 2017 than 2015 | Seasonal 1 Overall 0 |
| In quarter 2 2015 he sold about the same as in quarter 2 2016 He sells more each year | Seasonal 0 Overall 1 |
| Sold more computers in 2017 than the other 2 years Sales drop in the 3rd quarter each year | Overall 0 Seasonal 1 |
| Each quarter saw a difference in sales some higher some lower (not specific – which quarters) The number of computers sold each year has increased | Seasonal 0 Overall 1 |
| At the end of each year his sales have increased In quarter 3 in each year his sales drop | Seasonal 1 Overall 0 |
| His sales are rising on every 4 quarter during the year His sales fluctuate but are slowly rising | Seasonal 1 Overall 1 |
| Quarter 3 in 2016 has a decrease in sales on quarter 3 in 2015 2017 had the highest sales | Seasonal 0 Overall 0 |
| As the years went on the number of computers sold increased in quarter 4 Quarter 1 in 2015 was his lowest ever amount of sales | Seasonal 1 Overall 0 |
| The results seem to vary between each quarter They have increased | Seasonal 0 Overall 1 |
| The first quarter always has the lowest result It’s inconsistent in 2017 | Seasonal 1 Overall 0 |
| Every year quarter 1 increased by 7 He sold more computers in 2017 | Seasonal 1 BOD Overall 0 |
| In 2017 in quarter 4, Tom’s number of computers that were sold was the highest Tom sold the least amount of computers in quarter 1 in 2015 | Seasonal 0 Overall 0 |
| Answer | Marks | Part marks and guidance | |
|---|---|---|---|
| The trend in his sales will continue [at a similar rate] oe | 1 | Accept any correct relevant comment referring to general trend or 4th quarter trend isw extra statements See AG | |
Appendix: exemplar responses for Q8(d)
| Response | Mark |
|---|---|
| The number of computers he sells in the 4th quarter increases every year | 1 |
| Because in every 4th quarter he sells more than the year before | 1 |
| He assumes sales will continue to increase | 1 |
| The rate of number of sales has increased in quarter 4 | 1 |
| That the sales continue to go up as they have previously | 1 |
| That his sales will continue to rise and beat the last 4th quarter sale which was 58 | 1 |
| Sales will continue to rise [at a constant rate] | 1 |
| He has seen improvement in his graph | 0 |
| His sales will have a positive correlation between the year and amount sold | 0 |
| That he will sell more | 0 |
| That his figure in 2018 will be better than his figure in 2017 | 0 |