
Higher June 2021 Paper 1 Q18
18 The table and histogram give information about the distance travelled, in order to get to work, by each person working in a large store.
| Distance (d km) | Frequency |
|---|---|
| \(0 \leqslant d \lt 10\) | 40 |
| \(10 \leqslant d \lt 15\) | |
| \(15 \leqslant d \lt 20\) | |
| \(20 \leqslant d \lt 30\) | |
| \(30 \leqslant d \lt 60\) | 30 |
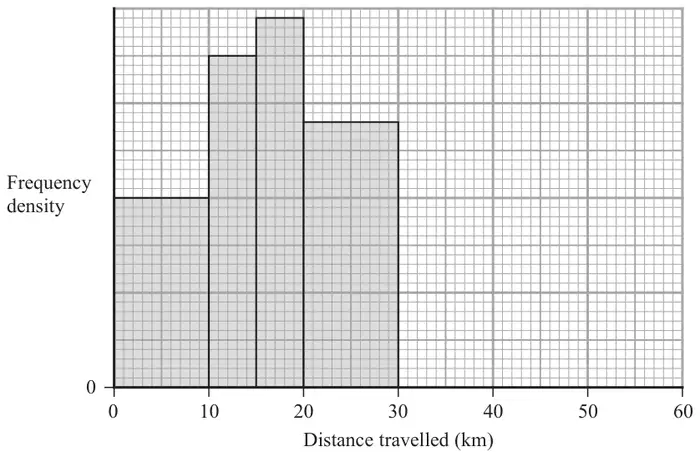
Using the information in the table and in the histogram,
(a) complete the table, (2)
(b) complete the histogram. (1)
One of the people working in the store is chosen at random.
(c) Work out an estimate for the probability that the distance travelled by this person, in order to get to work, was greater than 25 km. (2)
| Scheme | Marks |
|---|---|
| eg height of first bar labelled as FD 4 or one 1 cm by 1 cm square = 5 people or 1 line of 5 small squares = 1 person or one 2cm by 2 cm square = 20 people etc | M1 |
| Working not required, so correct answer scores full marks (unless from obvious incorrect working) Answer: 35, 39, 56 | A1 |
| (2) |
Notes
M1: for the use of frequency density – ie that area is proportional to frequency – with either a correct frequency density unambiguously labelled on axis or for an area representing a correct number of people or 2 correct frequencies completed
A1: All 3 correct
| Scheme | Marks |
|---|---|
| Correct bar | B1 |
| (1) |
Notes
B1: Width from 30 – 60 and height 1 cm
| Scheme | Marks |
|---|---|
| 0.5 × “56” + 30 (= 58) or 40 + “35” + “39” + “56” + 30 (= 200) | M1ft |
Working not required, so correct answer scores full marks (unless from obvious incorrect working) Answer: \(\dfrac{58}{200}\) | A1ft |
| (2) | |
| (5 marks) |
Notes
M1ft: follow through their stated value for \(20 \leqslant d \lt 30\) for total greater than 25 or ft their 3 values in the table for total
A1ft: ft dep on a completed table
oe eg \(\dfrac{29}{100}\) or 0.29 or 29%