
Higher January 2021 Paper 1R Q18
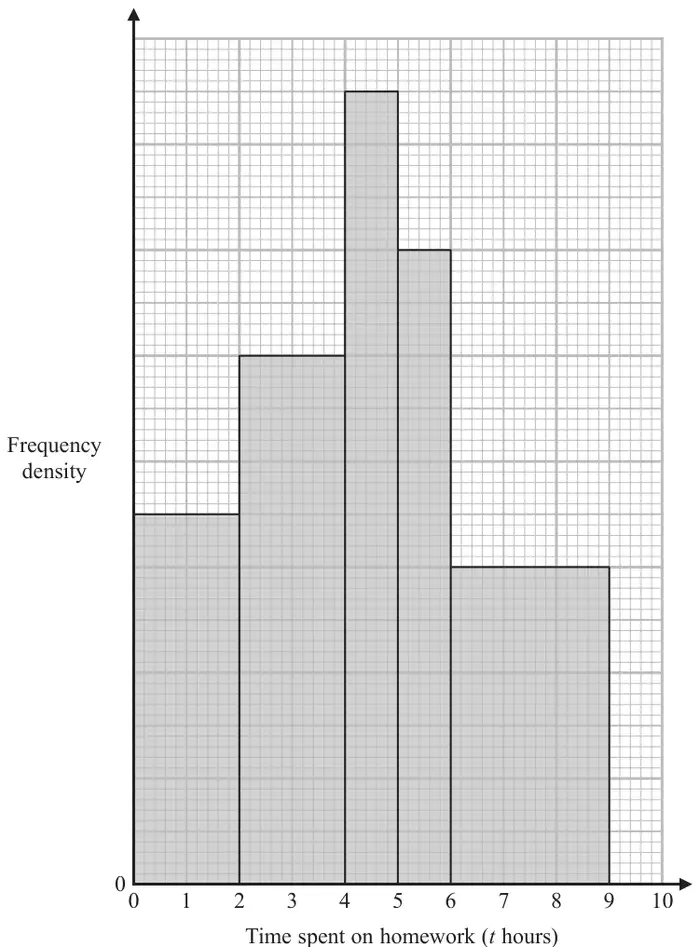
18 The histogram and the table give some information about the amounts of time, in hours, that Year 11 students at Bergdesh Academy spent, in total, on their homework last week.
No student in Year 11 spent longer than 9 hours on their homework.
| Time spent on homework (\(t\) hours) | Frequency |
|---|---|
| \(0 \lt t \leqslant 2\) | 28 |
| \(2 \lt t \leqslant 4\) | |
| \(4 \lt t \leqslant 5\) | |
| \(5 \lt t \leqslant 6\) | |
| \(6 \lt t \leqslant 9\) |
Using the information in the histogram and in the table, work out an estimate for the mean amount of time the Year 11 students spent on their homework last week.
Give your answer in hours correct to 3 significant figures.
(5)
| Scheme | Marks |
|---|---|
| E.g. 28 ÷ 2 (= 14) or 1cm2 = 2 students | M1 |
| 2 × 20 (= 40) 1 × 30 (= 30) 1 × 24 (= 24) 3 × 12 (= 36) or 40, 30, 24, 36 | M1 |
| 1 × 28 + 3 × ‘40’ + 4.5 × ‘30’ + 5.5 × ‘24’ + 7.5 × ‘36’ (= 685) or 28 + 120 + 135 + 132 + 270 (= 685) | M1 |
| ‘685’ ÷ (28 + ‘40’ + ‘30’ + ‘24’ + ‘36’) (= 4.335...) or ‘685’ ÷ 158 (= 4.335...) | M1 |
| Correct answer scores full marks (unless from obvious incorrect working) Answer: 4.34 | A1 |
| (5) | |
| (5 marks) |
Notes
M1: for method to find the frequency density for the first bar or any correct value on the fd axis or can be implied by a correct frequency (30 or 24 or 36)
M1: for method to find the missing frequencies (at least 3 correct)
M1: (indep ft) for a method to find the total (mid value × frequency) for at least 4 products using their values in the table (need not be evaluated)
Allow consistent use of end points for at least 4 products which must be added
M1: (dep on previous M1)
A1: accept 4.33 - 4.34