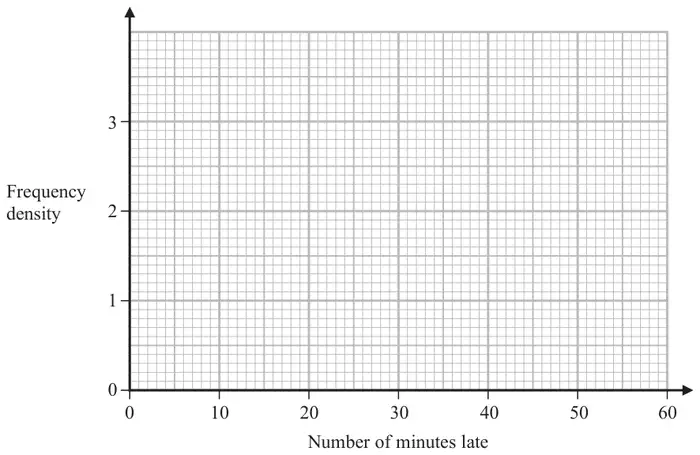
14 Manuel collected information about the flights that arrived late at an airport last month.
The table gives information about the number of minutes that these flights were late.
Minutes late (L minutes)
Frequency
\(0 \lt L \leqslant 10\)
8
\(10 \lt L \leqslant 15\)
13
\(15 \lt L \leqslant 25\)
19
\(25 \lt L \leqslant 40\)
24
\(40 \lt L \leqslant 60\)
6
(a) On the grid, draw a histogram for this information.(3)
Manuel selected at random a flight that was late by 25 minutes or less from his results.
(b) Work out an estimate for the probability that this flight was late by 5 minutes or less. (2)
Mark scheme (a)
Scheme
Marks
0.8, 2.6, 1.9, 1.6, 0.3 Answer: Correct histogram
B3
(3)
Notes
B3: fully correct histogram (B2 for at least 3 correct frequency densities or at least 3 correct bars or all five bars of correct width with heights in the correct ratio B1 for 2 correct frequency densities or 2 correct bars – but these bars must be of different widths, ie not 1st and 3rd) or three bars of correct width with heights in the correct ratio)
Mark scheme (b)
Scheme
Marks
M1
Correct answer scores full marks (unless from obvious incorrect working)
Answer: \(\dfrac{4}{40}\)
A1
(2)
(5 marks)
Notes
M1: for \(\dfrac{n}{40}\) where \(n \lt 40\) or for \(\dfrac{4}{m}\) where \(m \gt 4\)