
Higher November 2021 Paper 1 Q11
11 The table gives information about the times taken by 90 runners to complete a 10 km race.
| Time (t minutes) | Frequency |
|---|---|
| \(25 \lt t \leqslant 35\) | 12 |
| \(35 \lt t \leqslant 45\) | 24 |
| \(45 \lt t \leqslant 55\) | 28 |
| \(55 \lt t \leqslant 65\) | 12 |
| \(65 \lt t \leqslant 75\) | 10 |
| \(75 \lt t \leqslant 85\) | 4 |
| Time (t minutes) | Cumulative frequency |
|---|---|
| \(25 \lt t \leqslant 35\) | 12 |
| \(25 \lt t \leqslant 45\) | |
| \(25 \lt t \leqslant 55\) | |
| \(25 \lt t \leqslant 65\) | |
| \(25 \lt t \leqslant 75\) | |
| \(25 \lt t \leqslant 85\) |
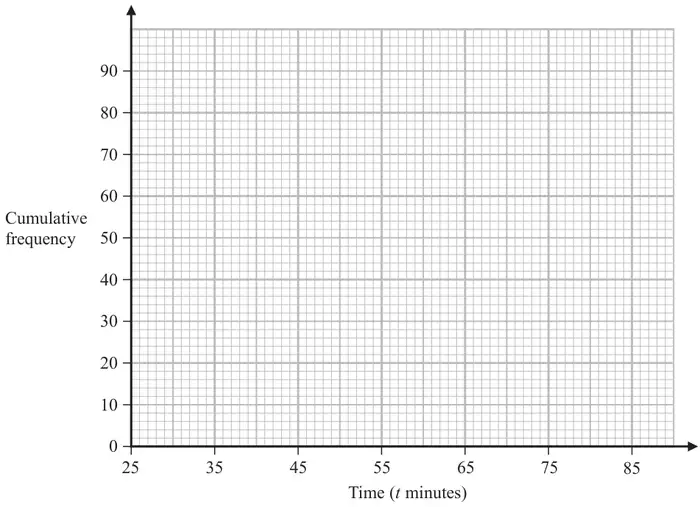
Any runner who completed the race in a time \(T\) minutes such that \(42 \lt T \leqslant 52\) minutes was awarded a silver medal.
| Scheme | Marks |
|---|---|
| (12), 36, 64, 76, 86, 90 | B1 |
| (1) |
| Scheme | Marks |
|---|---|
| M1 | |
| Correct cf diagram | A1 |
| (2) |
Notes
M1: ft from table for at least 5 points plotted correctly (± 0.5 squares) at end of interval
or
ft from (CF) table for all 6 points plotted consistently (± 0.5 squares) within each interval in the freq table at the correct height
A1: accept curve or line segments
accept graph that is not joined to (25, 0)
| Scheme | Marks |
|---|---|
| E.g. reading at 42 minutes and reading at 52 minutes | M1 |
| Correct answer scores full marks (unless from obvious incorrect working) Answer: 25 – 29 | A1ft |
| (2) | |
| (5 marks) |
Notes
M1: for correct use of 42 and 52, ft from a cum freq graph provided method is shown – e.g. a line vertically drawn to the graph from readings of 42 and 52 on the Time axis to meet the graph and then a horizontal line to the CF axis (even if wrongly read scale) or clear marks on the graph and CF axis that correspond to the correct readings or correct values from the CF axis
A1ft: Accept a single value in range 25 to 29 or ft from their cumulative frequency graph provided method is shown