
Higher January 2022 Paper 2R Q14
14 A group of 60 students each sat an algebra test and a geometry test.
Each test was marked out of 110
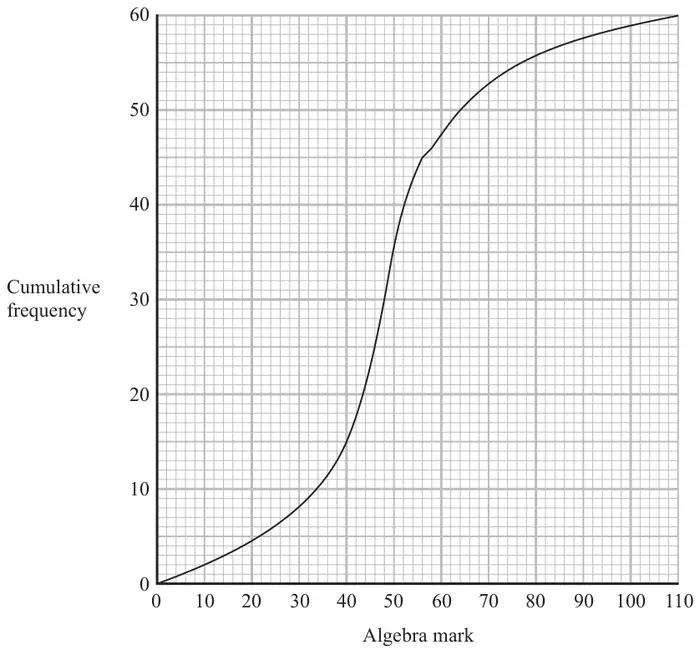
The cumulative frequency graph gives information about the marks gained by the 60 students in the algebra test.
The interquartile range of the marks gained in the geometry test is 9
Luis says
“The students’ marks are more spread out in the algebra test than in the geometry test.”
Give a reason for your answer. (1)
To be awarded a grade A in the algebra test, a student had to gain a mark greater than 64
Two students are to be selected at random from the 60 students in the group.
| Scheme | Marks |
|---|---|
| 48 | B1 |
| (1) |
Notes
| Scheme | Marks |
|---|---|
| 46 | B1 |
| (1) |
Notes
B1: allow 45.5 – 46.5
| Scheme | Marks |
|---|---|
| 40 and 56 | M1 |
| 16 to 18 | A1 |
| (2) |
Notes
M1: for both values. LQ of 40 – 41 and UQ in the range 56 – 58.
or for use of 15 and 45 (eg indicated by marks on horizontal axis that correspond to 15 and 45 on the vertical axis.)
or for use of 15.25 and 45.75 (eg indicated by marks on horizontal axis that correspond to 15.25 and 45.75 on the vertical axis.
A1: accept 16 to 18
| Scheme | Marks |
|---|---|
| Yes and correct reason | B1ft |
| (1) |
Notes
B1ft: dep on M1 in (c) but ft their reading of the horizontal axis.
For stating yes and the IQR for the Algebra test is greater than IQR for the Geometry test oe
If using value in (c) less than 9, only accept ‘no’ and IQR for the Algebra test is less than the IQR for the Geometry test oe.
| Scheme | Marks |
|---|---|
| 60 – ‘50’ (= 10) | M1 |
| \(\dfrac{\text{‘}{10}\text{’}}{60} \times \dfrac{\text{‘}{10}\text{’} - 1}{59}\) | M1 |
| \(\dfrac{3}{118}\) | A1 |
| (3) | |
| (8 marks) |
Notes
M1: for use of \(\dfrac{n}{60} \times \dfrac{n - 1}{59}\) with any integer \(n\) such that \(2 \leqslant n \leqslant 59\)