
Higher January 2019 Paper 1 Q18
18 The graph of \(y = \text{f}(x)\) is shown on the grid.
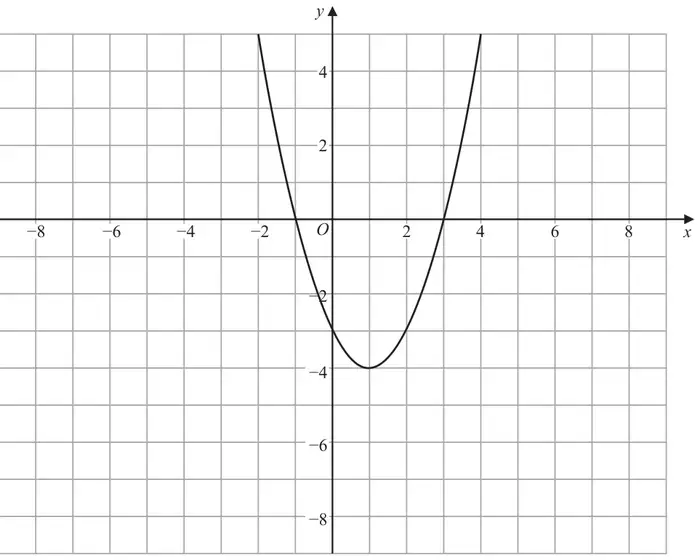
(a) On the grid above, sketch the graph of \(y = \text{f}\left(\dfrac{1}{2}x\right)\) (2)
The graph of \(y = \text{f}(x + k)\) is shown on the grid below.
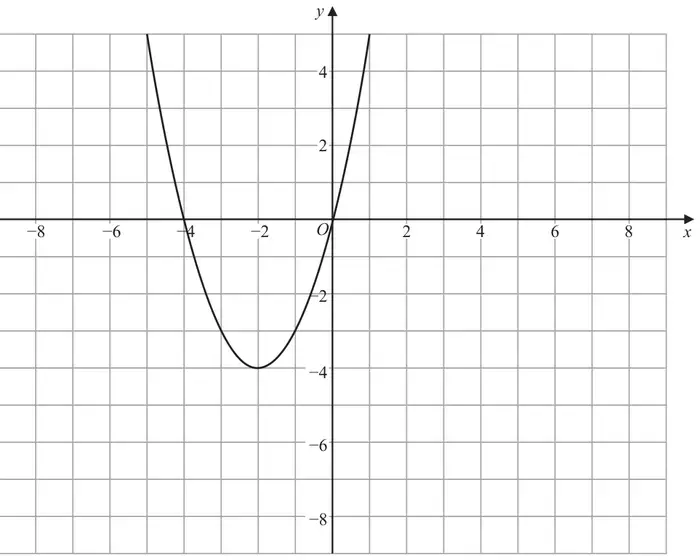
(b) Write down the value of \(k\) (1)
| Scheme | Marks |
|---|---|
| Parabola through \((-4, 5), (-2, 0), (0, -3), (2, -4), (4, -3), (6, 0), (8, 5)\) | B2 |
| (2) |
Notes
B2: For a parabola with minimum \((2, -4)\) through at least 5 of \((-4, 5), (-2, 0), (0, -3), (4, -3), (6, 0), (8, 5)\)
If not B2 then B1 For u-shaped parabola with minimum \((2, -4)\) or For u-shaped parabola through \((-2, 0), (6, 0)\) or For u-shaped parabola through \((-4, 5), (8, 5)\)
| Scheme | Marks |
|---|---|
| 3 | B1 |
| (1) | |
| (3 marks) |