
Higher June 2019 Paper 2R Q13
13 Sandeep recorded the length of time, in minutes, that each of 100 adults went for a walk one Saturday afternoon.
The cumulative frequency table gives information about these times.
| Time (\(t\) minutes) | Cumulative frequency |
|---|---|
| \(30 \lt t \leqslant 40\) | 6 |
| \(30 \lt t \leqslant 50\) | 20 |
| \(30 \lt t \leqslant 60\) | 56 |
| \(30 \lt t \leqslant 70\) | 84 |
| \(30 \lt t \leqslant 80\) | 95 |
| \(30 \lt t \leqslant 90\) | 100 |
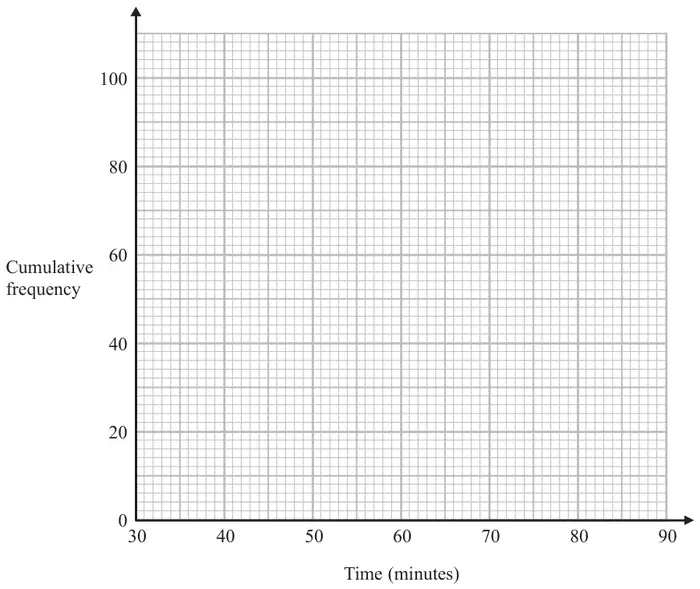
(a) On the grid, draw a cumulative frequency graph for the information in the table. (2)
(b) Use your graph to find an estimate for the median length of time that these adults went for a walk. (2)
One of the 100 adults is chosen at random.
(c) Use your graph to find an estimate for the probability that this adult went for a walk for more than 72 minutes. (3)
| Scheme | Marks |
|---|---|
| Plotting points from table at ends of interval (40, 6), (50, 20), (60, 56), (70, 84), (80,95), (90, 100) | M1 |
| Points joined with curve or line segments Answer: Correct cf diagram | A1 |
| (2) |
Notes
M1: ±½ sq (at least 5 points plotted correctly) Or all points plotted consistently within each interval at the correct heights
Accept cf graph which is not joined to (30,0)
| Scheme | Marks |
|---|---|
| Use of graph at 50 | M1 |
| 58 – 59 | A1 |
| (2) |
Notes
A1: No working shown and answer is within 58 – 59 award M1A1
| Scheme | Marks |
|---|---|
| 86 or 87 or 88 indicated on graph or stated | M1 |
| 100 – “86” or 100 – “87” or 100 – “88” | M1 |
| \(\dfrac{12}{100}\) oe \(\dfrac{13}{100}\) oe \(\dfrac{14}{100}\) | A1 |
| (3) | |
| (7 marks) |
Notes
M1: Use of their graph at 72 minutes
M1: Dep e.g. 12, 13 or 14 walkers
A1: 0.12 → 0.14 inc, oe