
Higher June 2018 Paper 1 Q10
10 The cumulative frequency graph shows information about the length, in minutes, of each of 80 films.
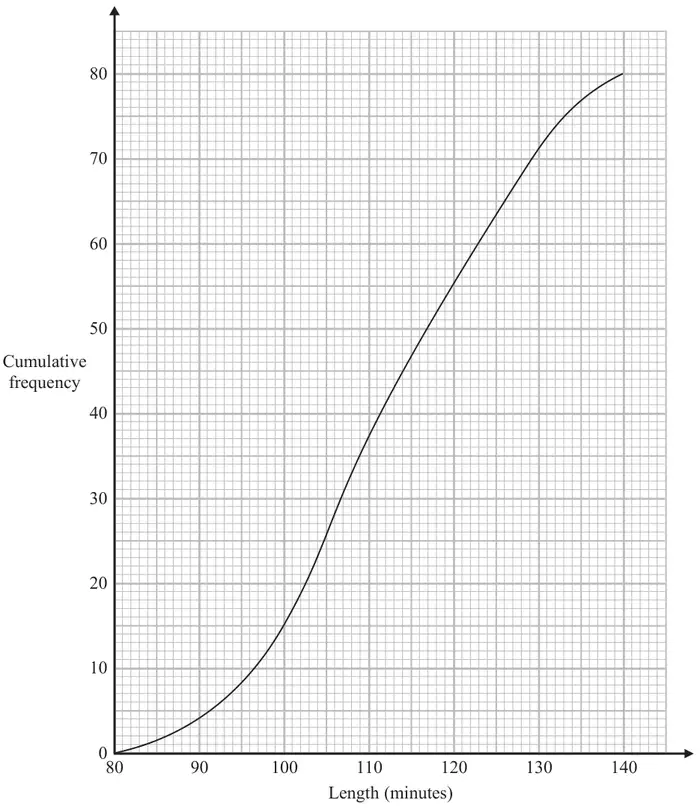
(a) Use the graph to find an estimate for the interquartile range. (2)
Clare says,
“More than 35% of these films are over 120 minutes long.”
(b) Is Clare correct?
Give a reason for your answer. (3)
Give a reason for your answer. (3)
| Scheme | Marks |
|---|---|
| Readings from graph at cf 20 and cf 60 eg. readings of 103 and 123 | M1 |
| 20.5 | A1 |
| (2) |
Notes
A1: for answer in range 19 – 21
| Scheme | Marks |
|---|---|
| Reading from graph from time = 120 (=55) or 80 – 55 (=25) | M1 |
0.35 × 80 (=28) or e.g. \(\dfrac{80 - \text{``}{55}\text{''}}{80} \times 100\) oe (=31(.25)) or \(\dfrac{\text{``}{55}\text{''}}{80} \times 100\) oe (= 68(.75)) | M1 |
| No with correct figures | A1 |
| (3) | |
| (5 marks) |
Notes
M1: accept reading in range 55 – 56
M1: accept a value in the range 30 – 31.25 or a value in the range 68 – 70 for this mark unless clearly from incorrect working
A1: eg. No with 28 and 25
or
No with 31.25%
(accept value in range 30% – 31.25%)
or
No with 68.75% and 65%
(accept value in range 68% – 70%)
| Scheme | Marks |
|---|---|
| 0.65 × 80 (=52) | M1 |
| Reading from graph from cf = 52 (=118) or Reading from graph from time = 120 (=55) | M1 |
| No with correct figures | A1 |
Notes
M1: accept reading in range 55 – 56
A1: eg. No with 118 (minutes)
or
No with 52 and 55