
Higher June 2017 Paper 4 Q20
20 The graph shows the speed, in metres per second, of a particle over the first four seconds of motion.
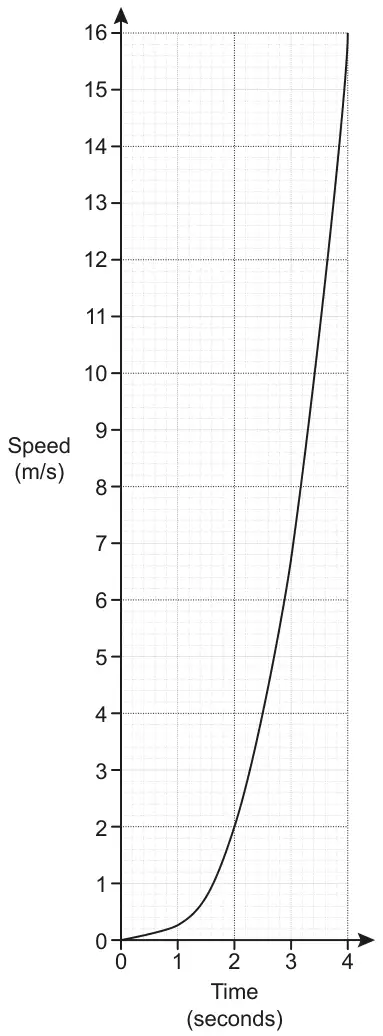
Use the graph to estimate the distance travelled by the particle in the four seconds. [2]
| Answer | Marks | Part marks and guidance | |
|---|---|---|---|
| evidence of finding the area under the graph | M1 | M1 for evidence of any correct method to find the area under the graph e.g. counting squares (numbers or dots in squares) or use of triangles, trapeziums or rectangles | |
| 15 to 22 | B1 | accept answer as a fraction | |