
Higher June 2017 Paper 4 Q12
12 The cumulative frequency graph shows the speeds, in miles per hour (mph), of vehicles passing a 40 mph speed limit sign on a road.
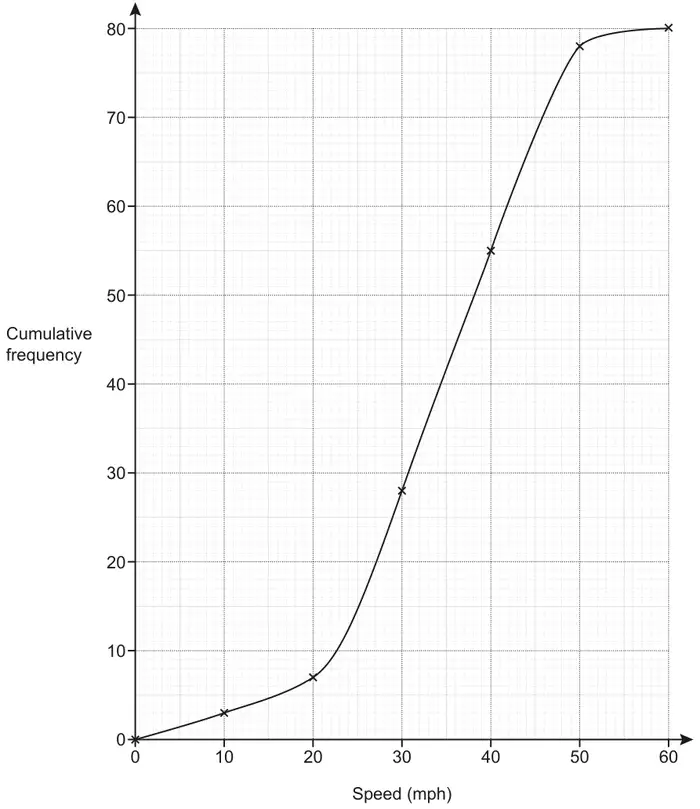
A speed camera will be installed if more than 30% of vehicles go over the speed limit of 40 mph.
Use information from the graph to decide if a speed camera should be installed. [4]
| Answer | Marks | Part marks and guidance | |
|---|---|---|---|
| 55 soi by 25 | B1 | condone if written on graph | accept any correct method e.g B1 for 55 M2 for [0].7 × 80 soi 56 or M1 for [0].3 × 80 soi 24 A1 for 55 and 56 so yes |
| 80 – their55 soi 25 | M1 | ||
| [0].3[0] × 80 soi 24 | M1 | or their 25 ÷ 80 or 31[%] or 31.2 to 31.3[%] | |
| 25 and 24 so yes oe | A1 | 31[%] or 31.2 to 31.3[%][and 30] so yes A1dep on both M1s and A1FT follow through from their 55 | |