
Higher January 2022 Paper 1 Q12
12 The table gives information about the times, in minutes, taken by 80 customers to do their shopping in a supermarket.
| Time taken (\(t\) minutes) | Frequency |
|---|---|
| \(0 \lt t \leqslant 10\) | 7 |
| \(10 \lt t \leqslant 20\) | 26 |
| \(20 \lt t \leqslant 30\) | 24 |
| \(30 \lt t \leqslant 40\) | 14 |
| \(40 \lt t \leqslant 50\) | 7 |
| \(50 \lt t \leqslant 60\) | 2 |
| Time taken (\(t\) minutes) | Cumulative frequency |
|---|---|
| \(0 \lt t \leqslant 10\) | |
| \(0 \lt t \leqslant 20\) | |
| \(0 \lt t \leqslant 30\) | |
| \(0 \lt t \leqslant 40\) | |
| \(0 \lt t \leqslant 50\) | |
| \(0 \lt t \leqslant 60\) |
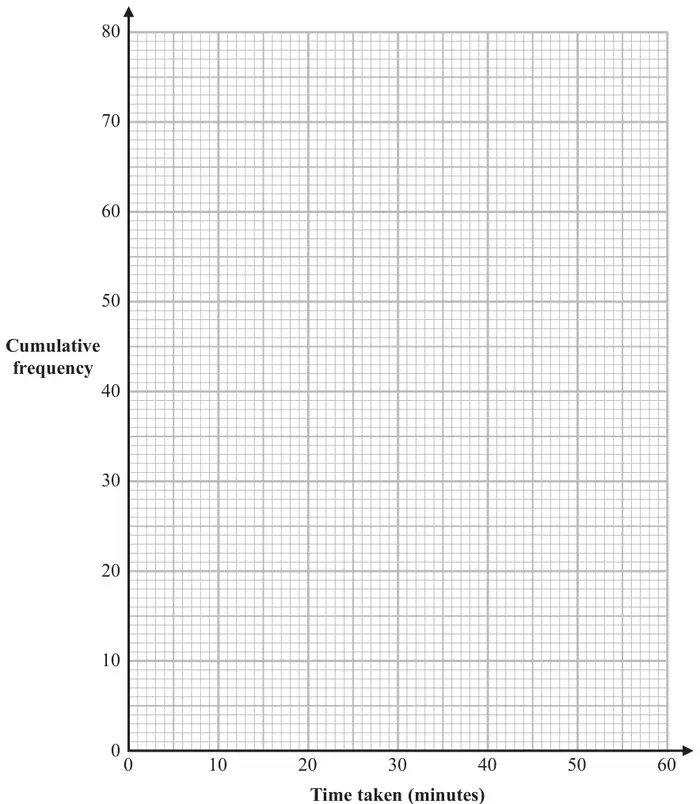
One of the 80 customers is chosen at random.
| Scheme | Marks |
|---|---|
| 7, 33, 57, 71, 78, 80 | B1 |
| (1) |
| Scheme | Marks |
|---|---|
| B2 | |
| (2) |
Notes
B2: Fully correct cf graph – points at ends of intervals and joined with curve or line segments.
If not B2 then B1(ft from a table with only one arithmetic error) for 5 or 6 of their points at ends of intervals and joined with curve or line segments
OR for 5 or 6 points plotted correct at ends of intervals not joined OR for 5 or 6 points from table plotted consistently within each interval (not at upper ends of intervals) at their correct heights and joined with smooth curve or line segments.
| Scheme | Marks |
|---|---|
| 21 – 24 | B1ft |
| (1) |
Notes
B1ft: any value in range or ft their cf curve
| Scheme | Marks |
|---|---|
| M1ft | |
| \(\dfrac{8}{80}\) | A1ft |
| (2) | |
| (6 marks) |
Notes
M1ft: eg reading of 72 – 74 or 6 – 8
could be seen as the numerator of a fraction
ft their cf graph
A1ft: oe, ft their cf graph
fractional answers must have an integer numerator and denominator