
Higher June 2022 Paper 2R Q11
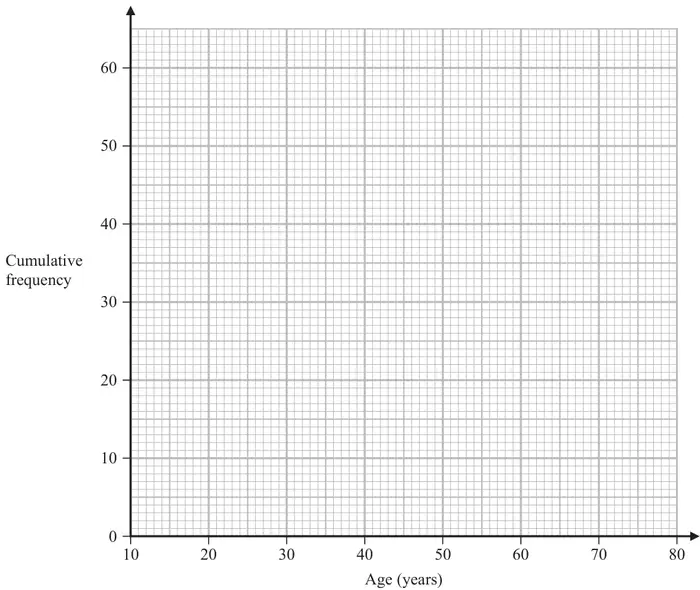
11 The cumulative frequency table shows information about the ages of 60 people who went to a gym on Saturday.
| Age (\(a\) years) | Cumulative frequency |
|---|---|
| \(10 \lt a \leqslant 20\) | 13 |
| \(10 \lt a \leqslant 30\) | 36 |
| \(10 \lt a \leqslant 40\) | 42 |
| \(10 \lt a \leqslant 50\) | 47 |
| \(10 \lt a \leqslant 60\) | 52 |
| \(10 \lt a \leqslant 70\) | 56 |
| \(10 \lt a \leqslant 80\) | 60 |
| Scheme | Marks |
|---|---|
| If a graph is ascending you can ft for the marks in parts (b), (c) and (d) – method should be shown by way of marks on the axes for all but the median in part (b) Answer: Correct cf graph | B2 |
| (2) |
Notes
B2: (use overlay) Fully correct cf graph – points at ends of intervals and joined with curve or line segments.
B1 for 6 or 7 points plotted correctly at ends of intervals not joined OR for 6 or 7 points from table plotted consistently within each interval (eg at lower bound of interval or midpoint of interval) at their correct heights and joined with smooth curve or line segments.
ignore the curve < age 20
| Scheme | Marks |
|---|---|
| 26 – 28 | B1ft |
| (1) |
Notes
B1ft: If out of range ft their graph
| Scheme | Marks |
|---|---|
| e.g. readings at 15 and 45 from the vertical axis eg LQ = 19 – 21 eg UQ = 45 – 47 (the reading at 45 is 45/46 so be careful with the award of this mark) | M1ft |
| 24 – 28 | A1ft |
| (2) |
Notes
M1ft: For use of 15 and 45, or 15.25 and 45.75
(eg reading of 21 and 46 stated or indicated by marks on horizontal axis that correspond to 15 (or 15.25) and 45 (or 45.75) on the vertical axis or correct readings ft their cf graph provided method to show readings is shown)
A1ft: Any value in range (if out of range ft their cf graph reading across at 15 and 45 oe but method must be shown)
| Scheme | Marks |
|---|---|
| eg reading of 49 or 50 from cf axis | M1ft |
| must be a whole number Answer: 10 or 11 | A1ft |
| (2) | |
| (7 marks) |
Notes
M1ft: For correct reading at 55 eg 50 (ft from incorrect graph if method shown (lines up and across))
A1ft: If out of range ft their cf curve if method shown