
Higher June 2022 Paper 1 Q21
21 The histogram shows information about the total time, \(m\) minutes, taken by each child in a school to walk to school every day for one week.
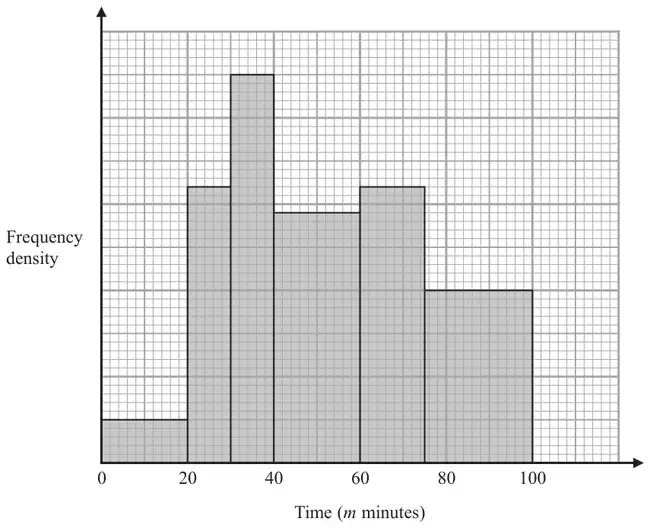
There are no children for whom \(m \gt 100\)
There are 10 children for whom \(m \leqslant 20\)
Work out an estimate for the number of children for whom \(50 \lt m \leqslant 80\)
(3)
| Scheme | Marks |
|---|---|
| 10 ÷ 20 (= 0.5) or a correct value on the FD scale and no errors or 25 small squares = 5 children or 5 small squares = 1 child oe or 1 small square = 0.2 children oe or 29 oe or 48 oe or 10 (associated with 75-80 bar) | M1 |
| (10 × 2.9) + (15 × 3.2) + (5 × 2) or 29 + 48 + 10 or (5.8 + 9.6 + 2) × 5 oe or (145 + 240 + 50) × 0.2 oe | M1 |
| 87 | A1 |
| (3) | |
| (3 marks) |
Notes
M1: for a fully correct method