
Higher January 2023 Paper 2R Q17
17 The table gives information about the time taken by each student in Year 11 to complete a homework task.
| Time taken (\(t\) minutes) | Frequency |
|---|---|
| \(10 \lt t \leqslant 25\) | 15 |
| \(25 \lt t \leqslant 30\) | 18 |
| \(30 \lt t \leqslant 50\) | 32 |
| \(50 \lt t \leqslant 60\) | 4 |
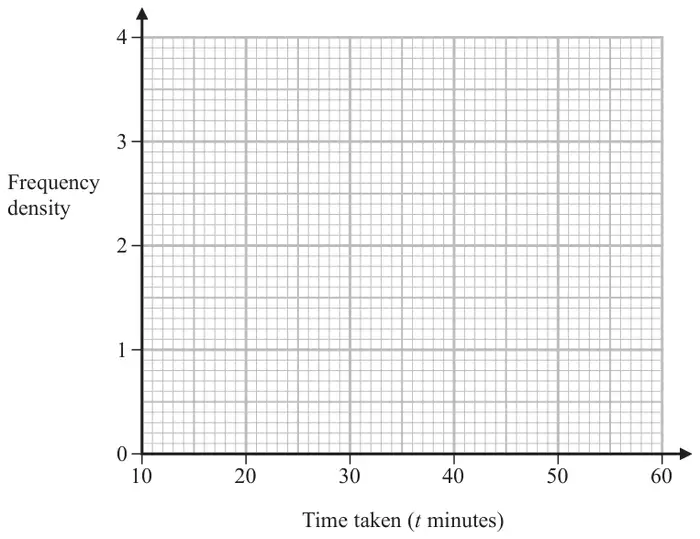
(3)
One of these students who took 50 minutes or less and more than 25 minutes to complete this homework task is chosen at random.
| Scheme | Marks |
|---|---|
| 15 ÷ 15 (= 1) 18 ÷ 5 (= 3.6) 32 ÷ 20 (= 1.6) 4 ÷ 10 (= 0.4) Answer: Correct histogram | B3 |
| (3) |
Notes
B3: for a fully correct histogram
If not B3 then B2 for 3 correct frequency densities (can be implied by heights) or 3 correct bars drawn
If not B2 then B1 for 2 correctly calculated frequency densities (can be implied by heights) or 2 correct bars drawn
SC: award B2 for all 4 bars of correct width with heights in the correct ratio (eg drawn at 0.5, 1.8, 0.8, 0.2)
SC: award B1 for 3 bars of correct width with heights in the correct ratio
| Scheme | Marks |
|---|---|
eg \(\dfrac{15}{20} \times 32\;(= 24)\) or \(\dfrac{5}{20} \times 32\;(= 8)\) or \(\dfrac{15}{20} \times 32 + 18\;(= 42)\) or \(32 + 18 - \dfrac{5}{20} \times 32\;(= 42)\) | M1ft |
Correct answer scores full marks (unless from obvious incorrect working) Answer: \(\dfrac{42}{50}\) | A1 |
| (2) | |
| (5 marks) |
Notes
M1ft: for a method to find an estimate for the number of students who took between 30 and 45 minutes or between 45 and 50 minutes or between 25 and 45 minutes
ft incorrect histogram
A1: oe eg \(\dfrac{21}{25}\), 0.84, 84%