(a) The price of a laptop is reduced in a January sale from £450 to £382.50.
Work out the percentage reduction in the price of the laptop. [3]
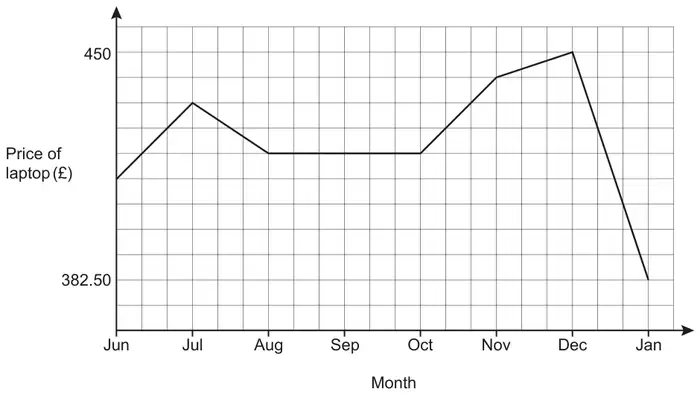
(b) The graph shows the price of the laptop in the months before the January sale.
Explain why this graph is misleading. [1]
Mark scheme (a)
Answer
Marks
Part marks and guidance
15
3
M2 for \(\left(1 - \dfrac{382.5[0]}{450}\right)\) [\(\times\) 100] oe or \(\left(\dfrac{450 - 382.5[0]}{450}\right)\) [\(\times\) 100] oe or \(\left(\dfrac{382.5[0] - 450}{450}\right)\) [\(\times\) 100] oe or M1 for \(\dfrac{382.5[0]}{450}\) [\(\times\) 100] oe
Condone \(-15\) for 3 marks M2 may be implied by \(\pm 0.15\) or \(\pm\left(\dfrac{67.5}{450}\right)\) or \(\pm\dfrac{3}{20}\)
M1 may be implied by 0.85 or 85 or \(\dfrac{17}{20}\)
Non-calculator methods score 3 marks for correct answer or M2 when equivalent to main scheme e.g. (second M2 method) 100(%) = 450 10(%) = 45 1(%) = 4.5 M2 \((450 - 382.5[0]) \div 4.5\)
Mark scheme (b)
Answer
Marks
Part marks and guidance
Vertical axis doesn’t start from 0 oe or Jan price looks [less than] half Dec price oe or the difference between 382[.50] and 450 looks much bigger than it really is oe
1
Ignore
any reference to the horizontal axis
any insufficient reason that does not contradict the correct reason (if two reasons given)
BUT, if two reasons offered and one reason clearly incorrect, mark the worst
See Appendix
Appendix
Question 18(b)
Assumption
Mark
Reason
The y-axis does not start at zero
1
Condone use of y-axis
The price axis does not start at zero
1
The months are in the wrong order and the y-axis doesn’t start from 0
1
Ignore reference to horizontal. Second is correct
Because it shows the drop in price is very bad but in reality, it’s not that much
1
BOD third reason
The graph does not start at zero
0
Ambiguous, implies the line starting at bottom left corner
It does not start at zero
0
“It” is not enough to identify vertical axis
There are no numbers between 382.5 and 450
0
Does not say “Not starting at zero”
The y-axis isn’t going up in equal amounts
0
Does not say “Not starting at zero”
The y-axis is not set out properly
0
Does not say “Not starting at zero”
It doesn’t start at the bottom of the graph/y-axis
0
Does not say “Not starting at zero”
y-axis scale uneven, not equal, not going up by the same value
0
they are assuming a start from zero (but don’t say it) and you can’t tell from two values
The gap on the y-axis is too large
0
For what?
No numbers for the interval between the two prices
0
Does not say “Not starting at zero”
There aren’t enough values on the y-axis
0
Does not say “Not starting at zero”
Does not have regular intervals
0
Does not say “Not starting at zero”
No clear scale for the y-axis
0
Does not say “Not starting at zero”
The scale is not complete
0
Does not say “Not starting at zero”
Because the price of the laptop axis starts from £382.50
0
Does not say “Not starting at zero”
It does not have all of the months from the start of the year