
Higher June 2025 Paper 4 Q14
14 The cumulative frequency graph shows the distribution of the examination scores for 120 students.
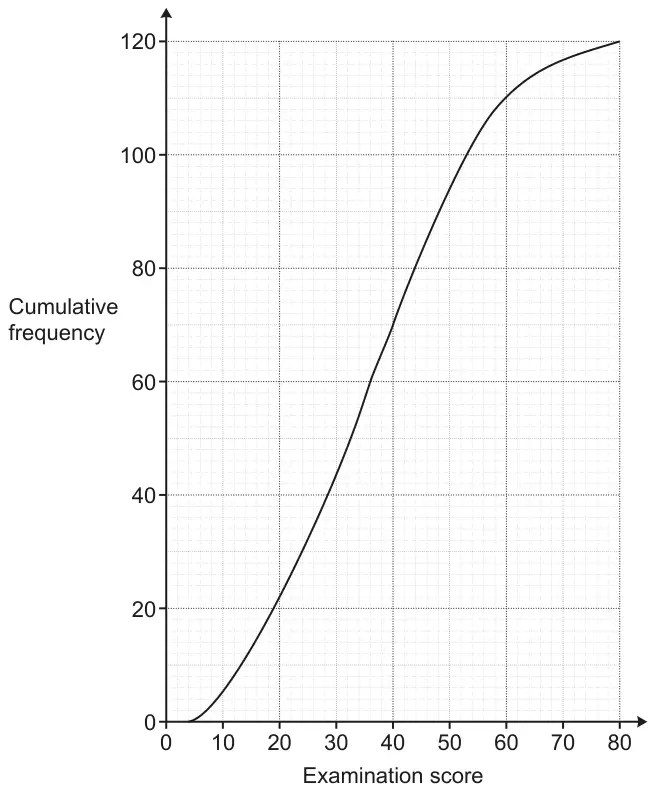
(a) A student says that they had an examination score of 34 and so were in the top half of the 120 students.
Is the student correct?
Give a reason for your decision. [2]
(b) The top 10% of the 120 students are awarded a commendation.
Find the minimum mark required for a commendation. [3]
| Answer | Marks | Part marks and guidance | |
|---|---|---|---|
| any evidence of reading (median) from cf = 60 or reading cf for score 34 | M1 | For M1 we need to see a line or mark on the graph or a figure allowing an error of ± ½ small square so for 60 allow reading from 59 – 61 giving 35 – 37 for 34 allow reading from 33 – 35 gives a reading of 51 – 57 figures may be in working, see appendix for some A1 statements | |
| No and a correct statement with [34 and] 35 – 37 or with 51 – 57 and 60 | A1 | ||
Appendix: exemplar responses for Q14(a)
| Response | Mark |
|---|---|
| 35 – 37 is half way and 34 is not high enough | 1 |
| 34 is less than 35 – 37 | 1 |
| 34 is at [c.f.] 51 – 57 which is less than 60 | 1 |
| 34 is at [c.f.] 51 – 57 which is 42.5% - 47.5% [percentile] and is less than 50% [percentile] | 1 |
| It is 1 – 3 marks short of halfway …. (implies 35 – 37) | 1 |
| 51 – 57 is under half of 120 | 0 |
| Answer | Marks | Part marks and guidance | |
|---|---|---|---|
| 58 | 3 | M2 for \(\frac{100 - 10}{100} \times 120\) oe or 108 or M1 for \(\frac{10}{100} \times 120\) oe or 12 | may be on the diagram |