
Higher June 2025 Paper 4 Q4
4
(a) Describe the correlation shown in each of these scatter diagrams. [2]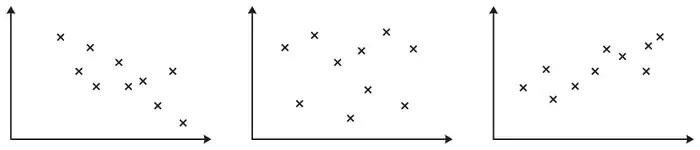
(b) A theatre records the number of seats sold and the profit made for 10 performances.
The scatter diagram shows these results.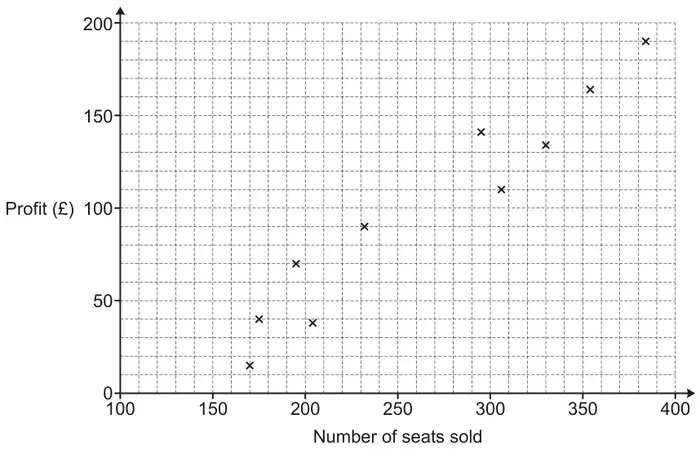
The scatter diagram shows these results.
By drawing a line of best fit, estimate the profit made when 250 seats are sold. [2]
| Answer | Marks | Part marks and guidance | |
|---|---|---|---|
| negative no correlation positive | 2 | B1 for 2 correct | accept none, neutral, zero or uncorrelated for no correlation ignore embellishments |
| Answer | Marks | Part marks and guidance | |
|---|---|---|---|
| acceptable ruled line of best fit | B1 | See overlay between (170, 10) and (170, 50) and between (380, 160) and (380, 200) and must reach the vertical lines, ignore beyond overlay | |
| FT their straight line, reading from 250 | B1FT | No line drawn 0 marks Line must have positive gradient. Correct reading ± 2 and their reading should be within the same grid square where their line(lobf) crosses 250 | |